Samsung 2009 Annual Report Download - page 34
Download and view the complete annual report
Please find page 34 of the 2009 Samsung annual report below. You can navigate through the pages in the report by either clicking on the pages listed below, or by using the keyword search tool below to find specific information within the annual report.-
 1
1 -
2
-
3
-
4
-
5
-
6
-
7
-
8
-
9
-
10
-
11
-
12
-
13
-
14
-
15
-
16
-
17
-
18
-
19
-
20
-
21
-
22
-
23
-
 24
24 -
 25
25 -
 26
26 -
 27
27 -
 28
28 -
 29
29 -
 30
30 -
 31
31 -
 32
32 -
 33
33 -
 34
34 -
 35
35 -
 36
36 -
 37
37 -
 38
38 -
 39
39 -
 40
40 -
 41
41 -
 42
42 -
 43
43 -
 44
44 -
45
-
46
-
47
-
48
-
49
-
50
-
51
 |
 |
64
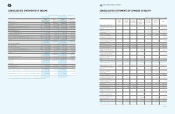
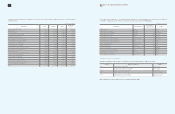
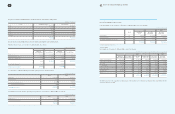
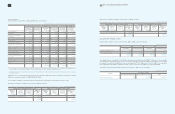
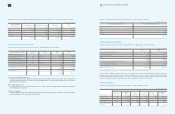
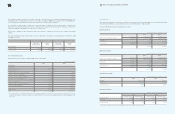
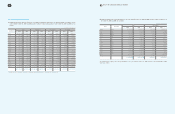
Eliminated unrealized gains and losses as of December 31, 2009 and 2008, are as follows:
Amounts in the table represent eliminated unrealized gains and losses for the years ended December 31, 2009 and 2008, recognized as
part of equity earnings (losses) from equity method investments.
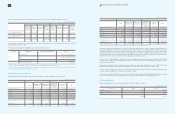
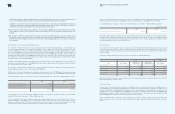
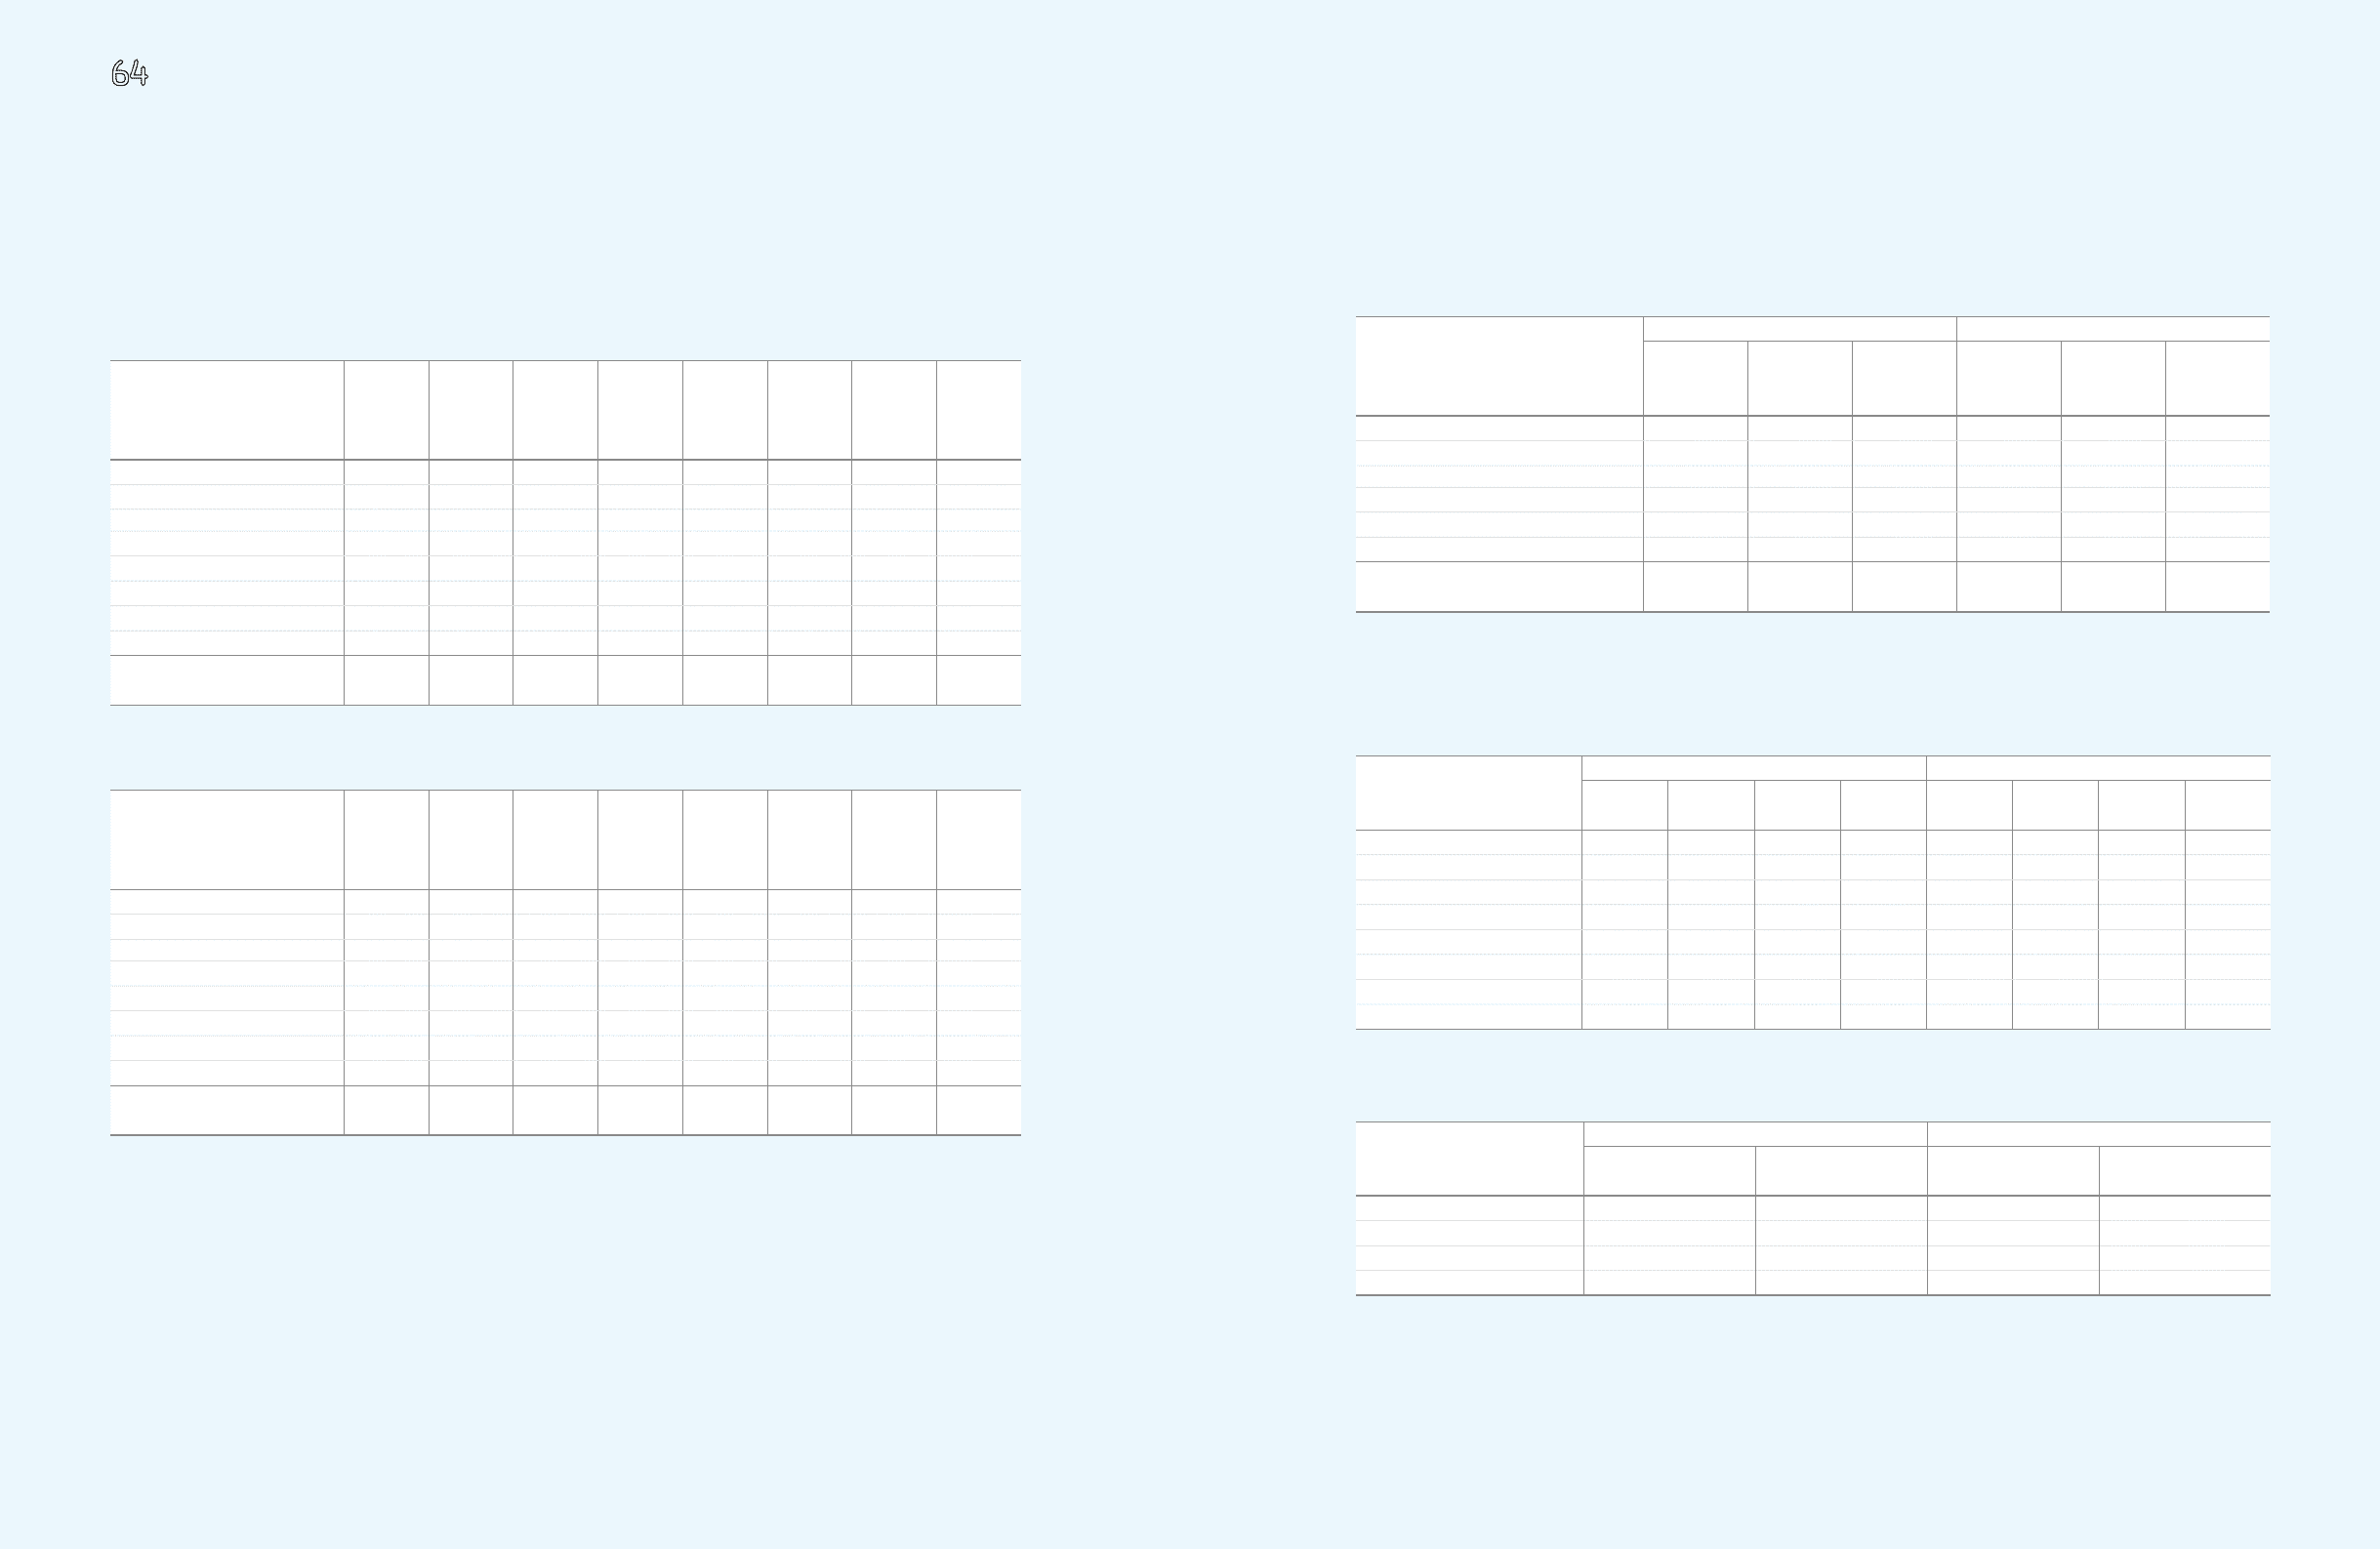
Financial information of investees as of and for the years ended December 31, 2009 and 2008, follows:
Market value information of publicly listed investees as of December 31, 2009 and 2008, are as follows:
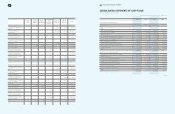
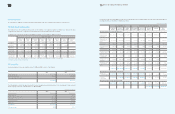
65 NOTES TO THE CONSOLIDATED FINANCIAL STATEMENTS
(In millions of Korean won)
2009 2008
Inventories
Property, Plant
and Equipment
and Intangible
Assets
Total Inventories
Property, Plant
and Equipment
and Intangible
Assets
Total
Samsung SDI
₩
(349)
₩
37
₩
(312)
₩
(645)
₩
170
₩
(475)
Samsung Electro- Mechanics (2,334) 183 (2,151) 3,125 8 3,133
Samsung Techwin 1,662 (69) 1,593 345 110 455
Samsung SDS (22) 4,181 4,159 (12) 779 767
Samsung Corning Precision Glass 28,294 450 28,744 (28,678) (7,219) (35,897)
Others (2,614) (6,566) (9,180) 395 312 707
₩
24,637
₩
(1,784)
₩
22,853
₩
(25,470)
₩
(5,840)
₩
(31,310)
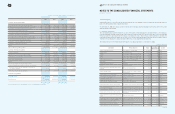
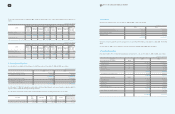
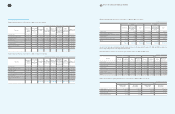
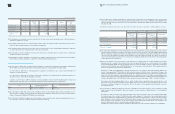
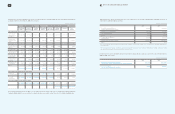
10. Equity-Method Investments
Equity-method investments as of December 31, 2009, consist of the following:
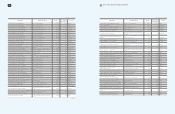
Equity-method investments as of December 31, 2008, consisted of the following:
(In millions of Korean won, except for the number of shares and percentage)
(In millions of Korean won, except for the number of shares and percentage)
Investee
Number of
Shares
Owned
Percentage
of
Ownership
(%)
Acquisition
Cost
Net
Book Value
of Investee
Balance at
Beginning
of Year
Earnings
(Losses)
From Equity
-Method
Investments
Other
Increase
(Decrease)
Balance at
End of Year
Samsung SDI 9,282,753 19.7
₩
423,722
₩
981,299
₩
874,079
₩
42,582
₩
45,475
₩
962,136
Samsung Electro-Mechanics 17,693,084 22.8 359,237 586,946 445,244 61,342 77,905 584,491
Samsung Techwin 13,526,935 25.5 174,531 276,008 272,833 45,710 (43,342) 275,201
Samsung SDS 11,977,770 21.3 12,753 299,756 223,376 60,616 (3,951) 280,041
Samsung Corning Precision Glass 7,512,165 42.5 297,165 2,401,963 1,771,209 1,146,890 (550,464) 2,367,635
Samsung Thales 13,500,000 50.0 135,000 162,174 146,956 15,203 - 162,159
Siltronic Samsung Wafers - 50.0 251,041 141,057 210,948 (65,936) (3,955) 141,057
Others 649,508 715,825 412,217 94,062 244,914 751,193
₩
2,302,957
₩
5,565,028
₩
4,356,862
₩
1,400,469
₩
(233,418)
₩
(5,523,913)
Investee
Number of
Shares
Owned
Percentage
of
Ownership
(%)
Acquisition
Cost
Net
Book Value
of Investee
Balance at
Beginning
of Year
Earnings
(Losses)
From Equity
-Method
Investments
Other
Increase
(Decrease)
Balance at
End of Year
Samsung SDI 9,282,753 19.7
₩
423,722
₩
892,938
₩
893,419
₩
7,175
₩
(26,515)
₩
874,079
Samsung Electro-Mechanics 17,693,084 22.8 359,237 445,531 445,205 13,708 (13,669) 445,244
Samsung Techwin 19,604,254 25.5 211,726 275,290 258,411 19,188 (4,766) 272,833
Samsung SDS 11,977,770 21.3 12,753 247,271 178,123 50,320 (5,067) 223,376
Samsung Corning Precision Glass 7,512,165 42.5 297,165 1,846,755 1,246,710 758,306 (233,807) 1,771,209
Samsung Thales 13,500,000 50.0 135,000 146,970 128,020 18,936 - 146,956
Siltronic Samsung Wafers - 50.0 264,410 210,939 184,830 (35,034) 61,152 210,948
Others 397,265 408,134 447,695 5,268 (40,746) 412,217
₩
2,101,278
₩
4,473,828
₩
3,782,413
₩
837,867
₩
(263,418)
₩
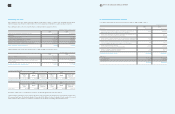
4,356,862 (In millions of Korean won)
2009 2008
Market Value
of Investee
Recorded
Book Value
Market Value
of Investee
Recorded
Book Value
Samsung SDI
₩
1,378,489
₩
962,136
₩
510,551
₩
874,079
Samsung Electro-Mechanics 1,902,007 584,491 589,180 445,244
Samsung Techwin 1,228,246 275,201 558,721 272,833
Samsung Digital Imaging 267,706 45,618 - -
(In millions of Korean won)
Investee
2009 2008
Assets Liabilities Sales Net Income
(Loss) Assets Liabilities Sales Net Income
(Loss)
Samsung SDI
₩
6,620,293
₩
1,633,195
₩
3,550,584
₩
217,992
₩
5,977,519
₩
1,440,231
₩
4,649,465
₩
38,874
Samsung Electro- Mechanics 4,219,378 1,645,073 3,192,031 278,476 3,194,434 1,240,349 3,099,821 48,080
Samsung Techwin 2,445,950 1,361,868 2,693,331 173,278 2,390,100 1,308,833 3,595,145 73,623
Samsung SDS 1,988,156 578,897 2,494,052 265,423 1,796,987 634,455 2,519,425 232,968
Samsung Corning Precision Glass 6,298,736 652,530 5,231,245 2,597,892 4,946,350 605,129 3,852,299 1,828,627
Samsung Thales 535,776 211,428 623,271 30,408 558,973 265,033 575,199 37,851
Siltronic Samsung Wafers 966,501 684,386 245,659 (131,855) 1,189,880 767,931 132,128 (70,064)
Others 3,447,305 1,601,700 6,031,128 318,972 1,910,088 733,441 3,707,142 128,818