Samsung 2009 Annual Report Download - page 45
Download and view the complete annual report
Please find page 45 of the 2009 Samsung annual report below. You can navigate through the pages in the report by either clicking on the pages listed below, or by using the keyword search tool below to find specific information within the annual report.-
 1
1 -
2
-
3
-
4
-
5
-
6
-
7
-
8
-
9
-
10
-
11
-
12
-
13
-
14
-
15
-
16
-
17
-
18
-
19
-
20
-
21
-
22
-
23
-
24
-
25
-
26
-
27
-
28
-
29
-
30
-
31
-
32
-
33
-
34
-
 35
35 -
 36
36 -
 37
37 -
 38
38 -
 39
39 -
 40
40 -
 41
41 -
 42
42 -
 43
43 -
 44
44 -
 45
45 -
 46
46 -
 47
47 -
 48
48 -
 49
49 -
 50
50 -
 51
51
 |
 |
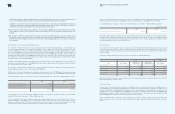
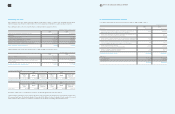
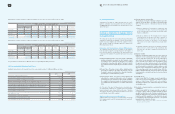
86 87 NOTES TO THE CONSOLIDATED FINANCIAL STATEMENTS
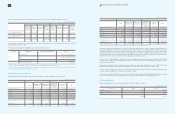
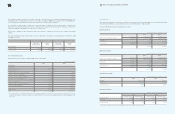
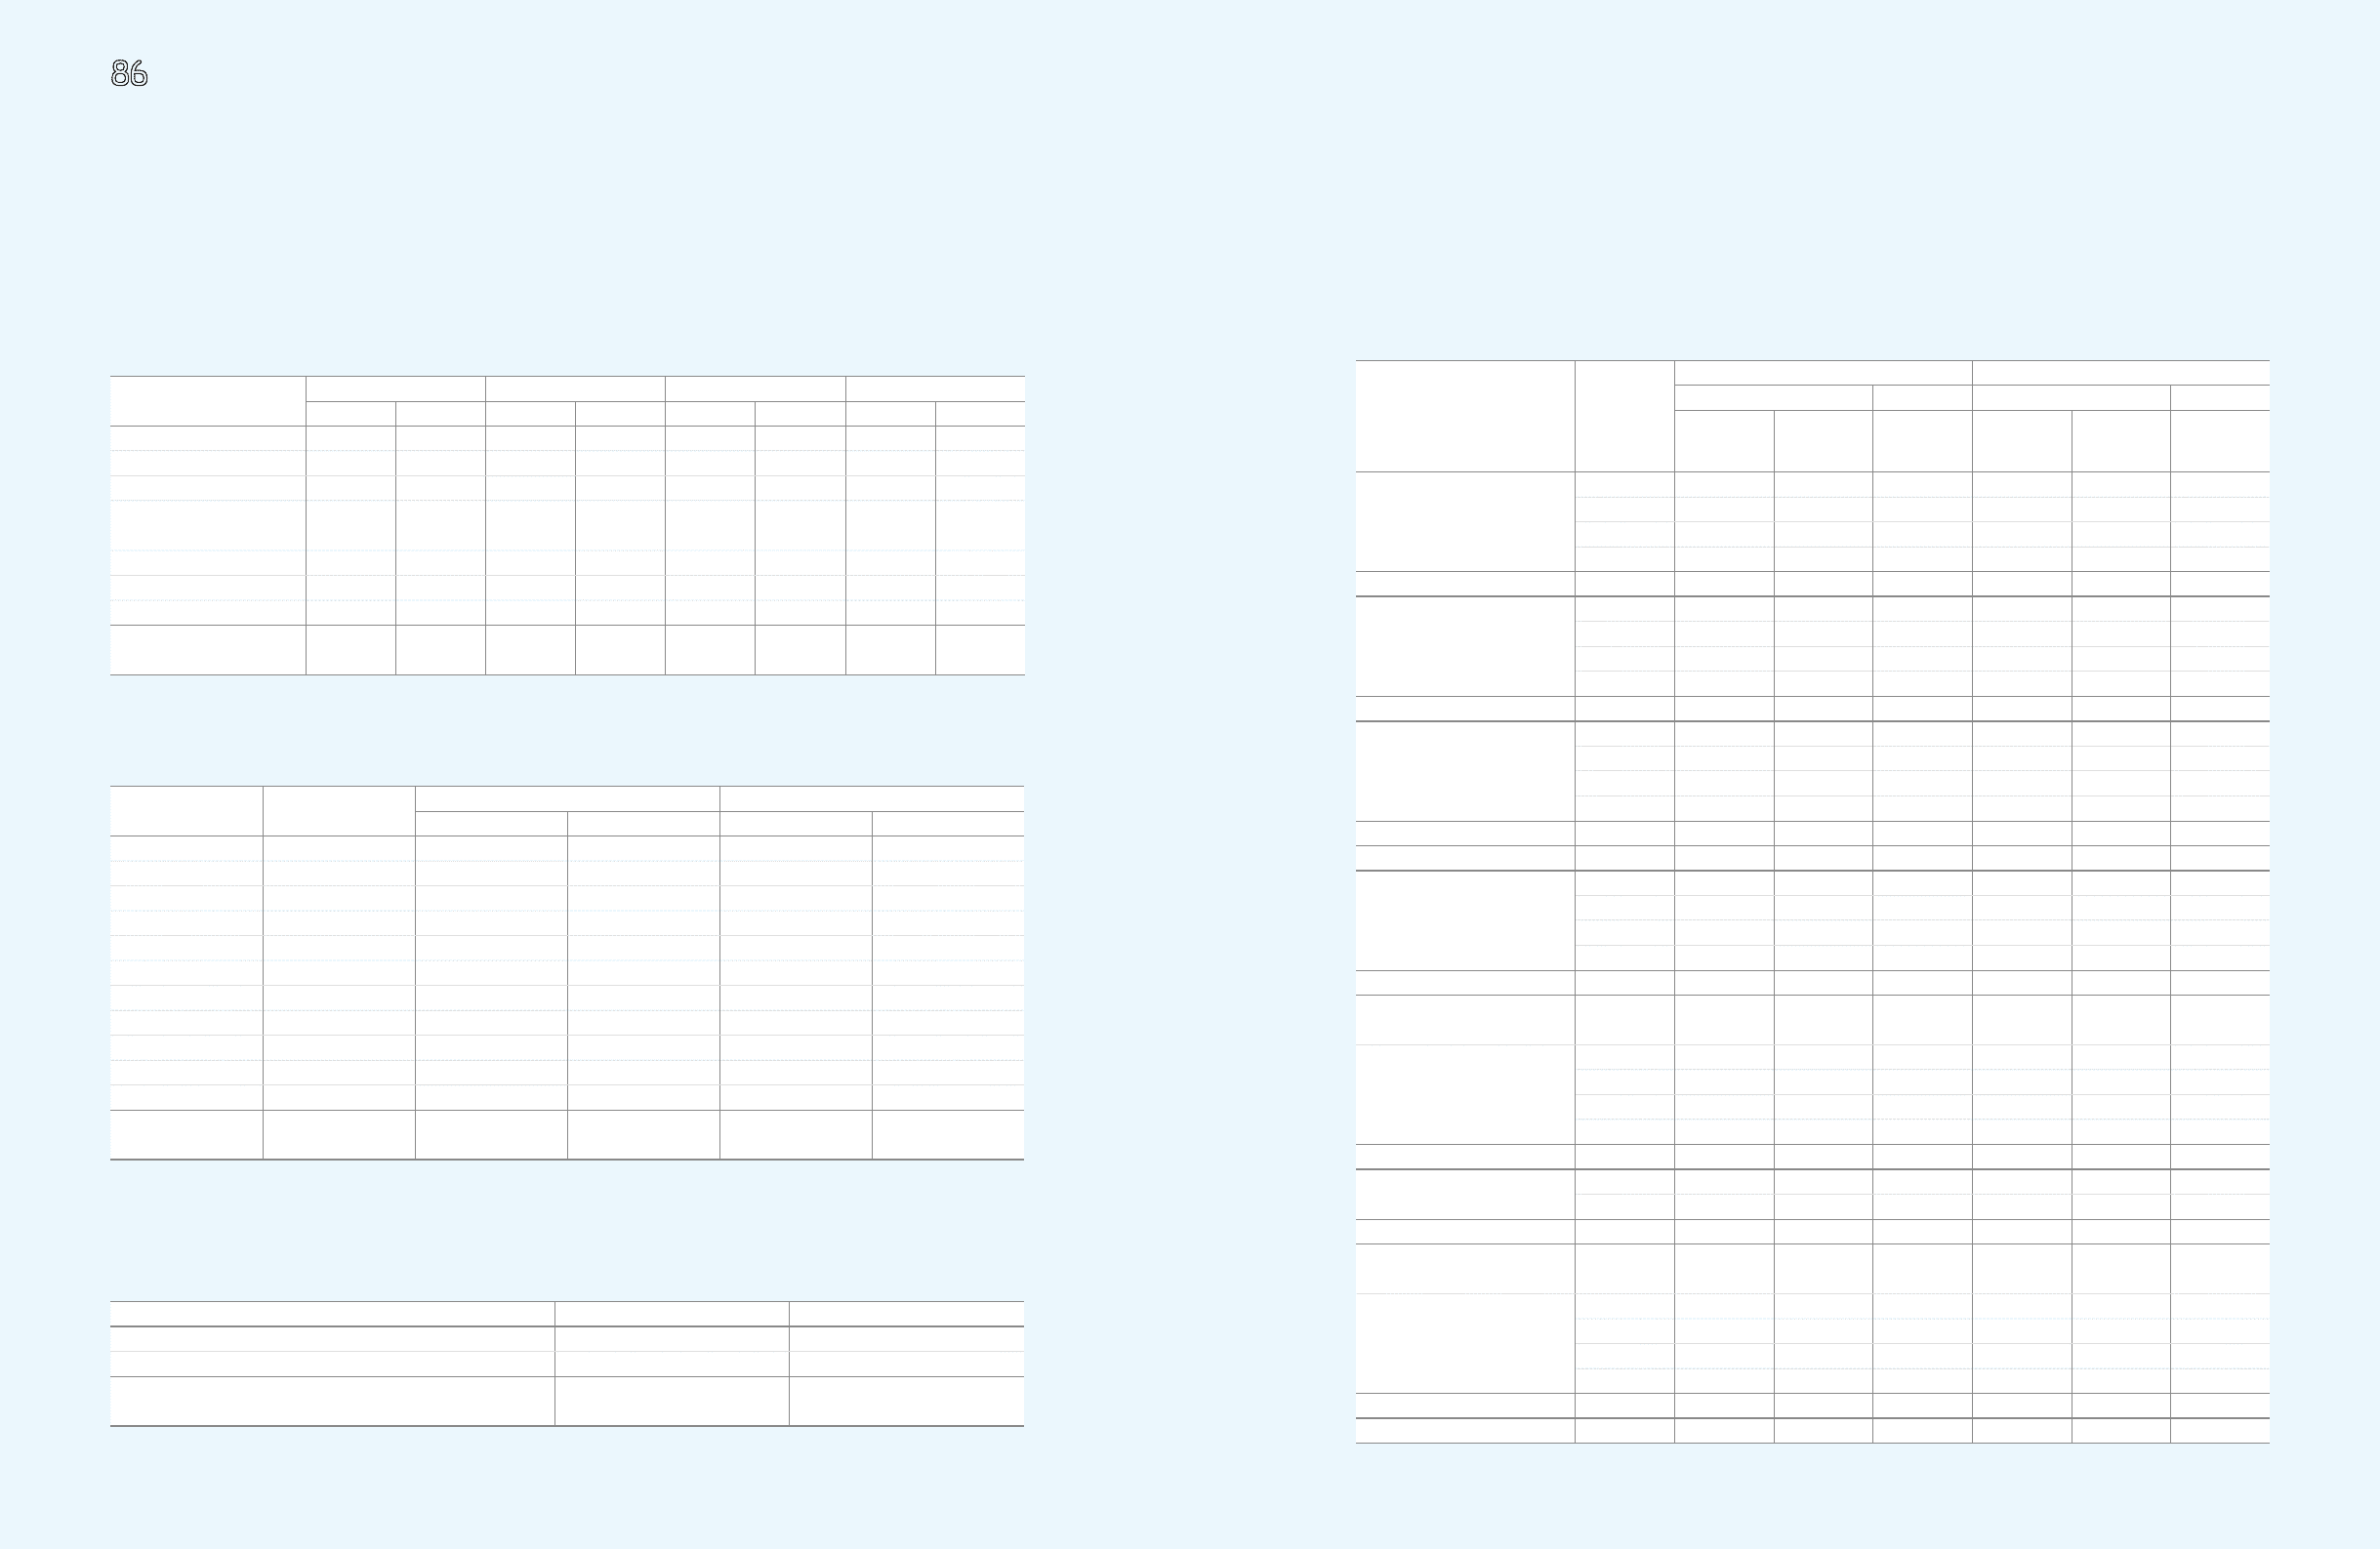
31. Related Party Transactions
(A) Significant transactions between SEC and equity-method investees for the years ended December 31, 2009 and 2008, and the
related receivables and payables as of December 31, 2009 and 2008, are as follows:
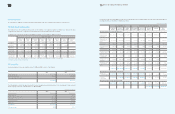
(B) Significant transactions between SEC subsidiaries and equity-method investees for the years ended December 31, 2009 and 2008,
and the related receivables as of December 31, 2009 and 2008, are as follows:
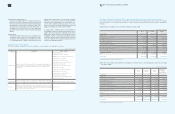
32. Research and Development Costs
Research and development costs incurred and expensed for the years ended December 31, 2009 and 2008, consist of the following:
(In millions of Korean won)
Equity-method Investees Sales Purchases Receivables Payables
2009 2008 2009 2008 2009 2008 2009 2008
Samsung SDI
₩
39,712
₩
91,363
₩
257,637
₩
569,683
₩
2,303
₩
2,831
₩
46,293
₩
48,093
Samsung SDS 28,944 60,166 805,690 933,386 8,072 8,549 240,127 243,765
Samsung Electro-Mechanics 15,263 17,540 1,056,247 1,172,753 1,086 2,281 56,972 62,025
Samsung Corning
Precision Glass 47,814 71,940 1,586,998 1,369,370 184 22,248 42,913 126,680
Samsung Techwin 33,953 77,804 298,545 507,263 11,092 24,985 16,963 88,973
Seoul Commtech 7,754 9,488 177,693 137,616 3,502 4,550 36,647 42,809
Others 116,725 126,854 382,843 353,786 45,044 29,534 103,634 86,137
₩
290,165
₩
455,155
₩
4,565,653
₩
5,043,857
₩
71,283
₩
94,978
₩
543,549
₩
698,482
(In millions of Korean won)
Seller Purchaser Sales Receivables
2009 2008 2009 2008
COR.P.G SLCD
₩
1,146,626
₩
914,389
₩
46,982
₩
92,448
SDIC SEA 269,858 - 96,906 -
SDI SII 200,495 300,780 3,088 3,209
SDI SESC 165,676 79,484 21,210 28,255
SJC SEMC 162,046 141,404 14,210 13,282
SSEG SLED 156,409 - 10,784 -
SJC SDI 134,022 230,836 28,084 52,276
SDIC SELS 116,229 - 12,715 -
SDI SDMA 95,419 82,969 3,145 4,928
SDIC SERC 94,502 - 20,382 -
Others 3,935,893 2,805,037 409,766 313,266
₩
6,477,175
₩
4,554,899
₩
667,272
₩
507,664
(In millions of Korean won)
2009 2008
Research expenses
₩
2,760,997
₩
2,677,815
Ordinary development expenses 4,855,167 4,380,095
₩
7,616,164
₩
7,057,910
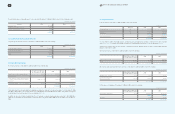
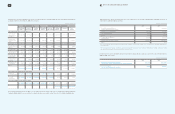
33. Assets and Liabilities Denominated in Foreign Currencies
As of December 31, 2009 and 2008, assets and liabilities denominated in foreign currencies are as follows:
(In millions of Korean won and foreign currencies)
Account Foreign
Currency
Foreign Companies Domestic Companies
2009 2008 2009 2008
Foreign
Currency
Amount
Korean Won
(Equivalent)
Korean Won
(Equivalent)
Foreign
Currency
Amount
Korean Won
(Equivalent)
Korean Won
(Equivalent)
Cash and cash equivalent, and
financial instruments
USD 1,035
₩
1,208,537
₩
1,348,191 314
₩
366,592
₩
890,384
JPY 2 31 55,110 6,227 78,634 139,389
EUR 731 1,224,176 632,326 81 135,604 -
Others 1,649,691 3,092,810 1,929,356 -
5,525,554 3,964,983 580,830 1,029,773
Trade accounts and notes
receivable
USD 2,666 3,112,807 920,706 2,518 2,939,457 247,613
JPY 105,759 1,335,551 1,303,857 17,368 219,331 35,778
EUR 2,149 3,598,387 3,433,126 185 309,169 147,685
Others 1,394,923 6,646,679 5,149,734 389 95,748 20,644
14,693,424 10,807,423 3,563,705 451,720
Other assets
USD 621 724,945 488,873 502 586,664 482,825
JPY 20,723 261,695 381,956 6,828 86,226 105,990
EUR 300 502,705 164,146 199 332,987 120,970
Others 234,687 1,410,463 916,842 160,803 145,758 6,069
2,899,808 1,951,817 1,151,635 715,854
Total foreign currency assets
₩
23,118,786
₩
16,724,223
₩
5,296,170
₩
2,197,347
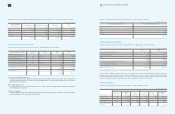
Trade accounts and notes payable
USD 1,079 1,260,260 473,898 2,425 2,831,016 852,338
JPY 72,341 913,539 923,185 13,292 167,854 262,333
EUR 265 443,636 178,380 15 25,852 10,341
Others 753,750 3,706,047 2,227,443 18 15,949 9,664
6,323,482 3,802,906 3,040,671 1,134,676
Short-term borrowings (including
document against acceptance) 3,450,260 4,109,022 3,286,339 2,990,203
Other current liabilities
USD 1,091 1,273,320 1,033,153 4,585 5,353,548 3,605,604
JPY 9,092 114,810 165,918 6,761 85,385 302,878
EUR 829 1,387,655 1,632,028 495 829,018 496,861
Others 891,704 2,501,637 2,247,139 57,771 193,938 148,339
5,277,422 5,078,238 6,461,889 4,553,682
Long-term other accounts payable USD - - 62,876 768 896,535 318,078
Others 840 21,076 97,827 - - 4,608
21,076 160,703 896,535 322,686
Foreign currency notes and bonds
(including current portions) USD 25 29,190 62,875 261 305,161 344,808
Long-term debts (including current
Maturities)
USD 512 598,043 644,090 50 58,380 314,375
JPY 5,736 72,435 77,500 4,107 51,860 69,101
EUR 25 41,682 - - - -
Others 8,090 310,541 241,091 - - -
1,022,701 962,681 110,240 383,476
Total foreign currency liabilities
₩
16,124,131
₩
14,176,425
₩
14,100,835
₩
9,729,531