Samsung 2009 Annual Report Download - page 26
Download and view the complete annual report
Please find page 26 of the 2009 Samsung annual report below. You can navigate through the pages in the report by either clicking on the pages listed below, or by using the keyword search tool below to find specific information within the annual report.-
 1
1 -
2
-
3
-
4
-
5
-
6
-
7
-
8
-
9
-
10
-
11
-
12
-
13
-
14
-
15
-
 16
16 -
 17
17 -
 18
18 -
 19
19 -
 20
20 -
 21
21 -
 22
22 -
 23
23 -
 24
24 -
 25
25 -
 26
26 -
 27
27 -
 28
28 -
 29
29 -
 30
30 -
 31
31 -
 32
32 -
 33
33 -
 34
34 -
 35
35 -
 36
36 -
37
-
38
-
39
-
40
-
41
-
42
-
43
-
44
-
45
-
46
-
47
-
48
-
49
-
50
-
51
 |
 |
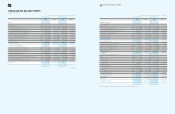
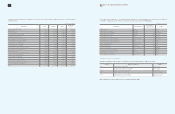
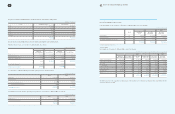
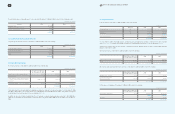
48 49 NOTES TO THE CONSOLIDATED FINANCIAL STATEMENTS
(In millions of Korean won and in thousands of U.S. dollars (Note 3))
2008 2008
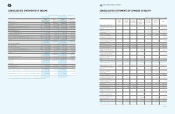
Cash flows from investing activities
(Increase) decrease in short-term financial instruments 1,445,781 1,238,887
Proceeds from sale of short-term available-for-sale securities 3,576,436 3,064,641
Acquisition of short-term available-for-sale securities (3,580,000) (3,067,695)
Decrease (increase) in deposits and loans
Proceeds from disposal of property, plant and equipment
Acquisition of property, plant and equipment (14,088,184) (12,072,137)
Proceeds from sale of long-term available-for-sale securities 188,332 161,381
Proceeds from sale of long-term held-to-maturity securities 31,234 26,764
Proceeds from sale of equity-method investments 16,682 14,295
Acquisition of long-term available-for-sale securities (12,602) (10,799)
Acquisition of equity-method investments - -
Others (495,212) (424,346)
Net cash used in investing activities (13,128,424) (11,249,721)
Cash flows from financing activities
Payment of dividends (1,315,486) (1,127,237)
Net (decrease) increase in short-term borrowings 668,383 572,736
Repayment of current maturities of long-term debts (1,826,860) (1,565,433)
Repayment of long-term debts (415,275) (355,848)
Proceeds from long-term debts 4,346,404 3,724,425
Others 477,055 408,787
Net cash (used in) provided by financing activities 1,934,221 1,657,430
Effect of exchange rate changes on cash and cash equivalents 813,514 697,099
Net increase in cash and cash equivalents from changes in
consolidated subsidiaries 3,263 2,796
Net increase in cash and cash equivalents 2,982,649 2,555,826
Cash and cash equivalents
Beginning of year 5,831,989 4,997,420
End of the year
₩
8,814,638 $ 7,553,246
The accompanying notes are an integral part of these consolidated financial statements.
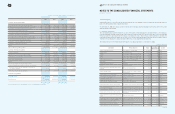
1. The Company
Samsung Electronics Co., Ltd. (“SEC”) was incorporated under the laws of the Republic of Korea to manufacture and sell semiconductors,
LCDs, telecommunication products, digital media products.
As of December 31, 2009, SEC’s shares are listed on the Korea Stock Exchange, and its global depository receipts are listed on the London
and Luxembourg Stock Exchange.
Consolidated Subsidiaries
The consolidated financial statements include the accounts of SEC and its controlled subsidiaries (collectively referred to as “the Company”).
Controlled subsidiaries generally include majority-owned entities and entities in which SEC owns more than 30% of the total outstanding
voting stock and is the largest shareholder. Percentage of ownership is the sum of the percentage of direct and indirect ownership. The
consolidated financial statements include the accounts of the consumer financing subsidiary, Samsung Card in accordance with the
Statement of Korean Financial Accounting Standards (“SKFAS”) No.25, Consolidated Financial Statements.
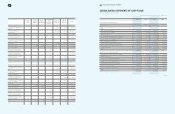
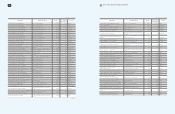
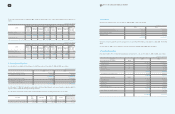
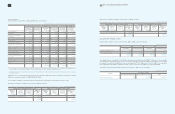
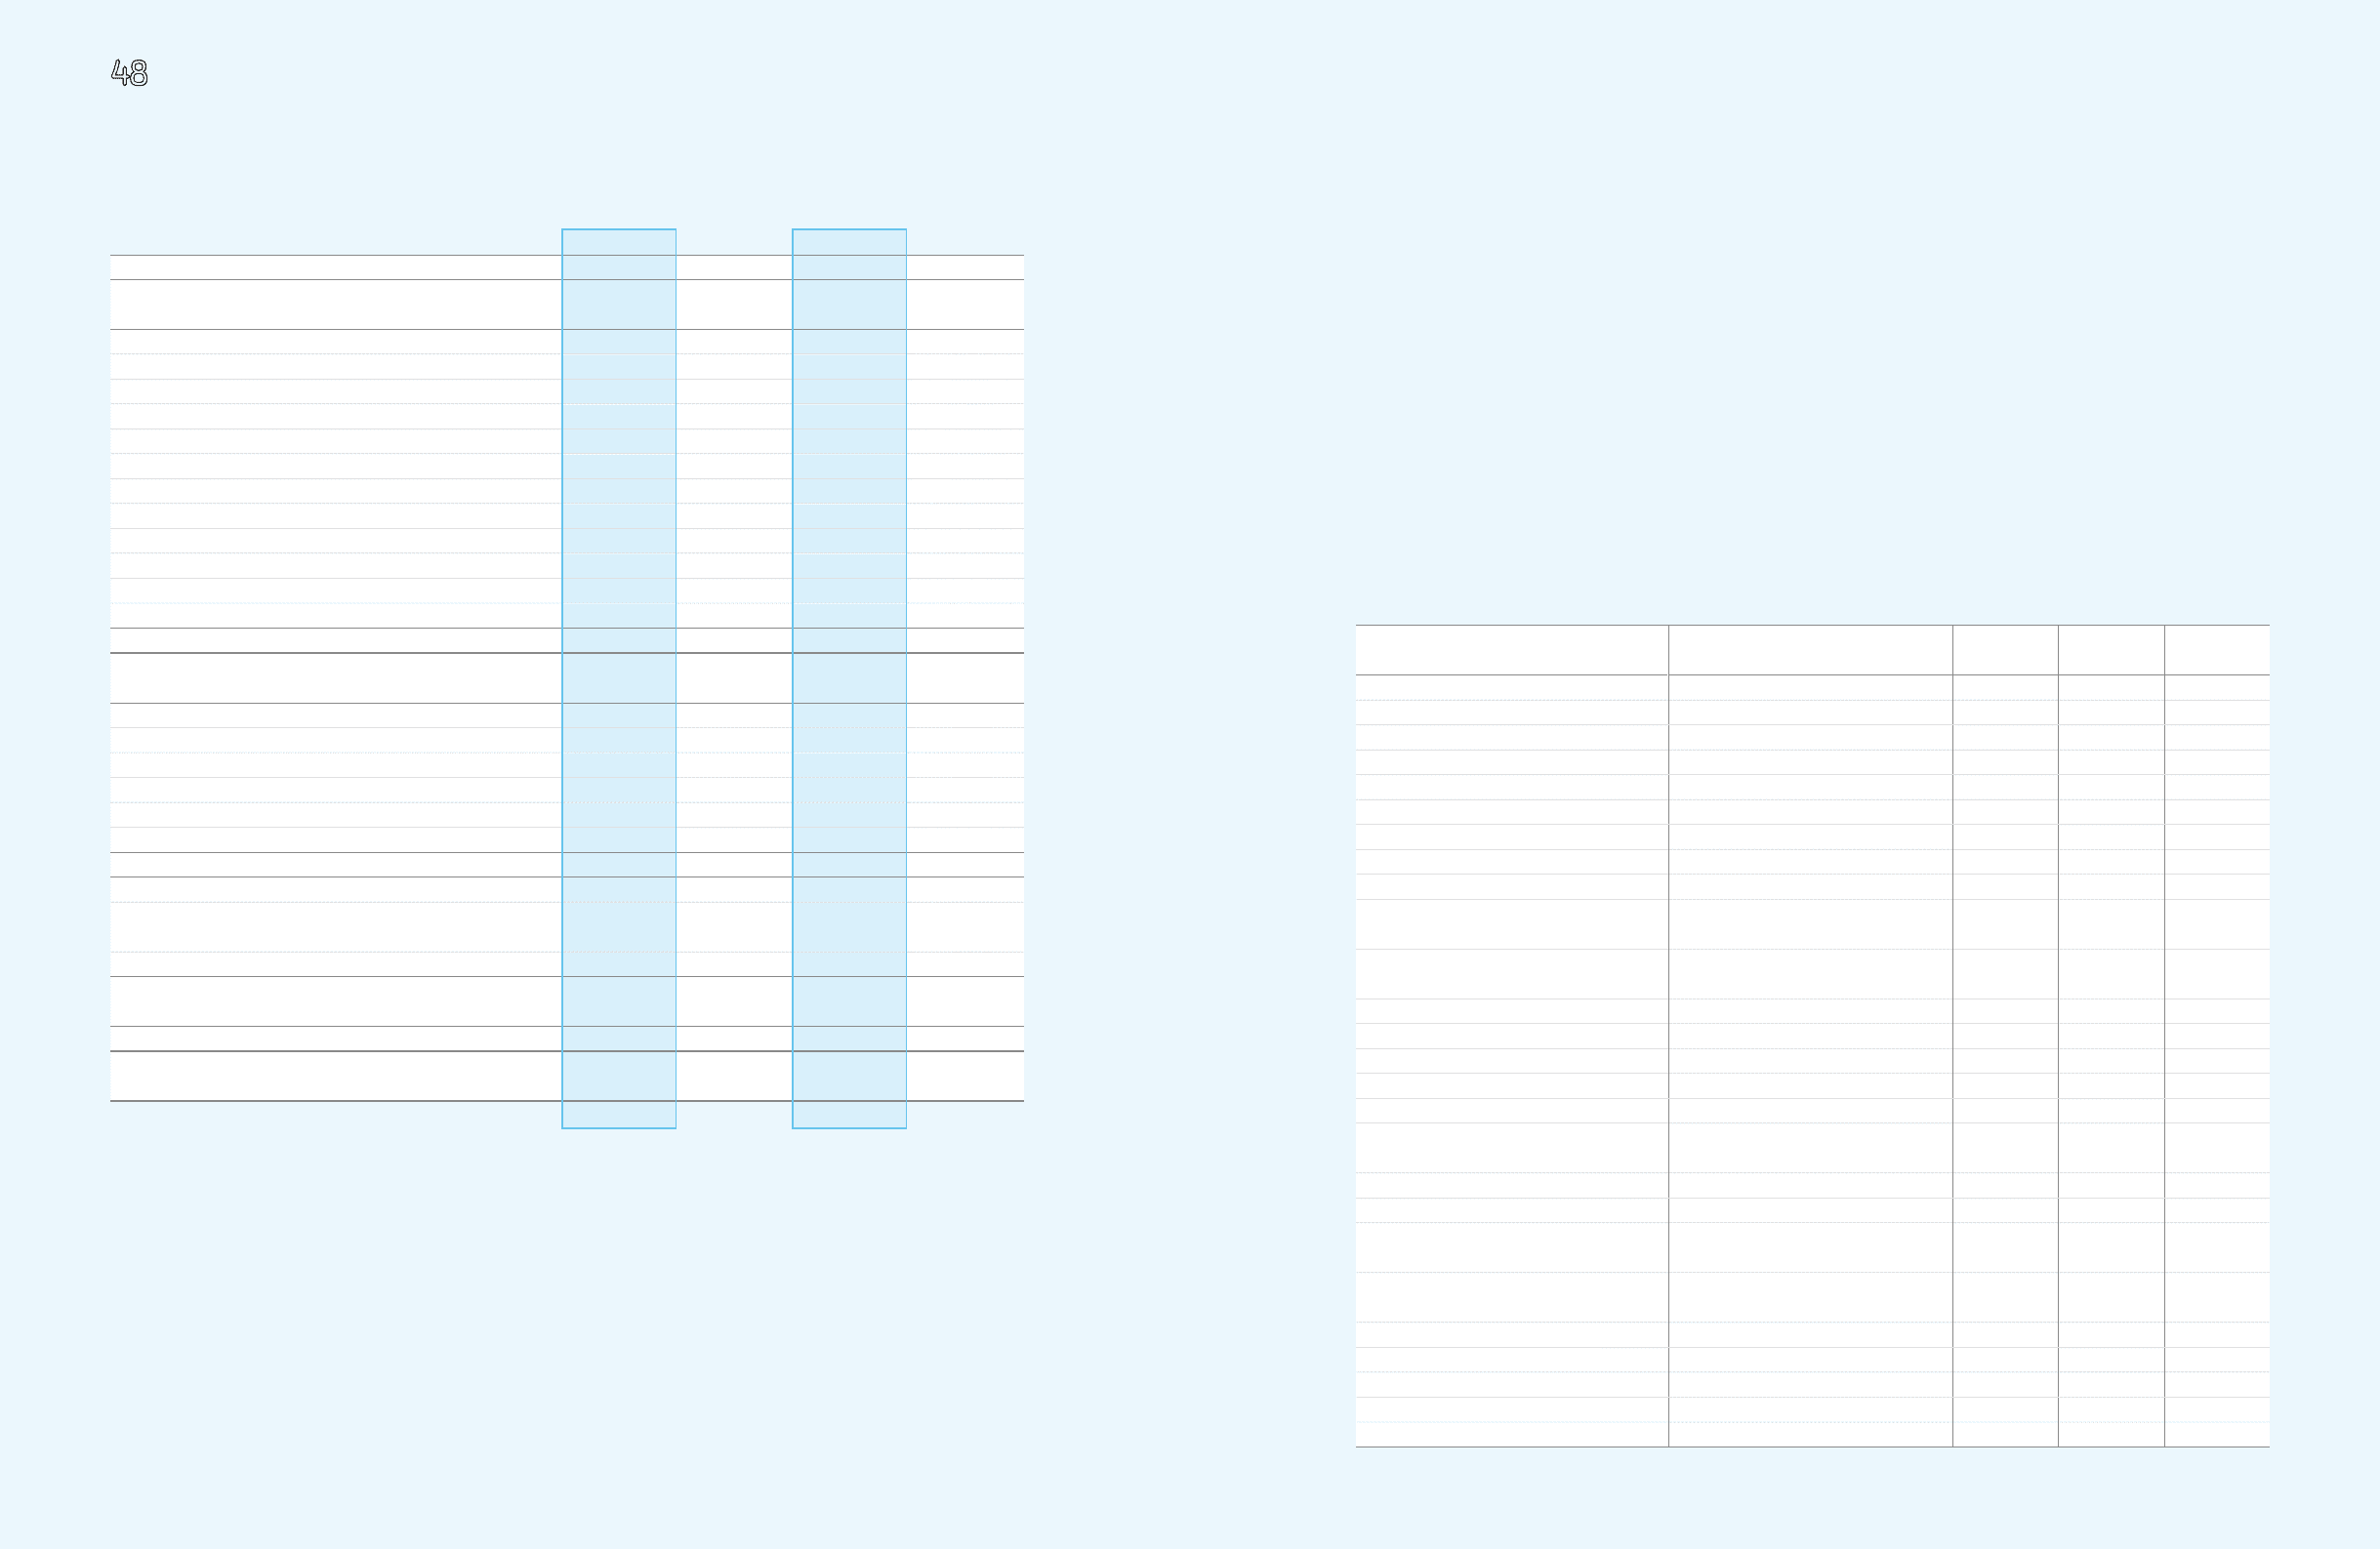
The following table sets forth certain information with regard to consolidated subsidiaries as of December 31, 2009.
NOTES TO THE CONSOLIDATED FINANCIAL STATEMENTS
December 31, 2009 and 2008
(In millions of Korean won)
Subsidiaries Primary Business Equity Percentage of
Ownership (%) Location
Samsung Gwangju Electronics Home appliances manufacturing
₩
768,530 94.3 Korea
Samsung Card Consumer financing 4,421,513 35.3 Korea
STECO Semiconductor equipment manufacturing 67,093 51.0 Korea
SEMES Semiconductor equipment manufacturing 119,966 63.9 Korea
Secron Semiconductor equipment manufacturing 38,846 50.6 Korea
Samsung Electronics Service Service center for electronic goods 61,823 83.3 Korea
Living Plaza Sales 136,254 100.0 Korea
Samsung Electronics Logitech Distribution 49,404 100.0 Korea
S-LCD LCD manufacturing 4,105,047 50.0 Korea
Samsung Electronics Hainan Fiberoptics Korea
(SEHF-K) Optical cable manufacturing 52,432 100.0 Korea
Samsung Mobile Display Mobile communication equipment display
manufacturing 1,525,564 50.0 Korea
Samsung Electronics Canada (SECA) Sale of electronic goods 107,251 100.0 Canada
Samsung Electronics America (SEA) Sale of electronic goods 3,769,120 100.0 U.S.A
Samsung Receivables (SRC) Financing 2,168,112 100.0 U.S.A
Samsung Semiconductor (SSI) Semiconductor sales 2,580,288 100.0 U.S.A
Samsung Austin Semiconductor (SAS) Semiconductor manufacturing 2,359,866 100.0 U.S.A
Samsung Information Systems America (SISA) Information system research and development 36,164 100.0 U.S.A
Samsung International (SII) Manufacturing and sale of electronic goods 199,671 100.0 U.S.A
Samsung Mexicana (SAMEX) Manufacturing and sale of electronic goods 56,540 100.0 Mexico
Samsung Telecommunications America (STA) Mobile phone sales and research and
development 345,046 100.0 U.S.A
Samsung Electronics Latinoamerica (Zona Libre)
(SELA) Sale of electronic goods 61,138 100.0 Panama
Samsung Electronics Latinoamerica Miami (SEMI) Sale of electronic goods and mobile phone 32,957 100.0 U.S.A
Samsung Electronica Columbia (SAMCOL) Sale of electronic goods 8,856 100.0 Columbia
Samsung Electronics Mexico (SEM) Manufacturing and sale of electronic goods 120,588 100.0 Mexico
Samsung Electronics Argentina (SEASA) Sale of electronic goods 7,038 100.0 Argentina
Samsung Electronica da Amazonia (SEDA) Sale and manufacturing of electronic goods 655,613 100.0 Brazil
continued
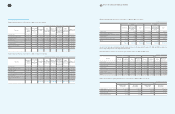
2009
(5,057,503)
2,673,309
(3,774,993)
₩
68,108
112,379
(8,182,197)
114,961
28,901
44,832
(69,804)
(261,539)
(120,555)
(14,424,101)
(871,173)
(976,336)
(2,367,129)
(675,677)
940,960
1,016
(3,948,339)
440,958
296,947
2,021,255
8,814,638
₩
10,835,893
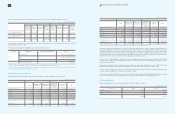
2009
(4,333,764)
2,290,753
(3,234,784)
$ 58,362
96,297
(7,011,308)
98,510
24,765
38,416
(59,815)
(224,112)
(103,304)
(12,359,984)
(746,506)
(836,620)
(2,028,388)
(578,986)
806,307
869
(3,383,324)
377,856
254,453
1,732,009
7,553,246
$ 9,285,255