Samsung 2009 Annual Report Download - page 35
Download and view the complete annual report
Please find page 35 of the 2009 Samsung annual report below. You can navigate through the pages in the report by either clicking on the pages listed below, or by using the keyword search tool below to find specific information within the annual report.-
 1
1 -
2
-
3
-
4
-
5
-
6
-
7
-
8
-
9
-
10
-
11
-
12
-
13
-
14
-
15
-
16
-
17
-
18
-
19
-
20
-
21
-
22
-
23
-
24
-
 25
25 -
 26
26 -
 27
27 -
 28
28 -
 29
29 -
 30
30 -
 31
31 -
 32
32 -
 33
33 -
 34
34 -
 35
35 -
 36
36 -
 37
37 -
 38
38 -
 39
39 -
 40
40 -
 41
41 -
 42
42 -
 43
43 -
 44
44 -
 45
45 -
46
-
47
-
48
-
49
-
50
-
51
 |
 |
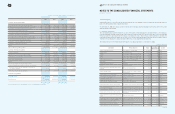
66 67 NOTES TO THE CONSOLIDATED FINANCIAL STATEMENTS
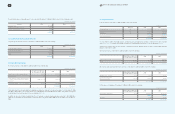
1. Others include amounts from changes in scope of consolidation and changes in foreign currency exchanges rates.
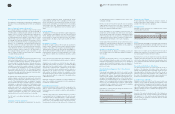
In accordance with the Asset Revaluation Law, on January 1, 1980, 1982, 1998 and April 1, 1999, SEC revalued a substantial portion of its
property, plant, equipment and investments in equity securities by
₩
3,051,612 million. The remaining revaluation increments amounting to
₩
1,208,872 million, net of revaluation tax, credits to deferred foreign currency translation losses and others, were credited to capital surplus,
a component of equity. Also, in accordance with the Asset Revaluation Law, on October 1, 2000, Samsung Gwangju Electronics, an SEC
subsidiary, revalued a portion of its property, plant and equipment by
₩
63,326 million. The remaining revaluation increments amounting to
₩
62,145 million, net of revaluation tax, were credited to capital surplus, a component of equity.
As of December 31, 2009 and 2008, a certain portion of overseas subsidiaries' property, plant and equipment amounting to
₩
5,518 million
equivalent to US$ 4,726 thousand and
₩
5,766 million equivalent to US$ 4,585 thousand, respectively is pledged as collaterals for various
loans from financial institutions.
Property, plant, equipment are insured against fire and other casualty losses, and business interruption losses of up to
₩
92,254,561 million
(2008:
₩
85,564,185 million) and
₩
22,234,148 million (2008:
₩
22,764,493 million), respectively as of December 31, 2009.
The value of land owned by the SEC and its domestic subsidiaries based on the posted price issued by the Korean tax authority amounted
to
₩
4,782,545 million (2008:
₩
4,675,376 million) as of December 31, 2009.
As of December 31, 2009 and 2008, Samsung Card, an SEC subsidiary, recorded
₩
449,226 million (2008:
₩
690,187 million) of operating
lease assets, cancellation lease assets and prepaid finance lease assets acquired through the lease financing business (Note 8).
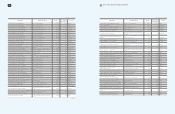
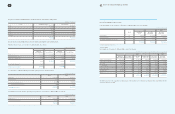
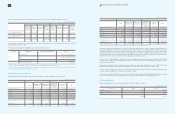
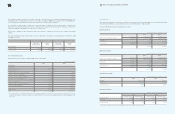
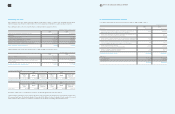
12. Intangible Assets
Changes in intangible assets for the years ended December 31, 2009 and 2008, are as follows:
Location 2009 2008
Goodwill
₩
67,402
₩
9,885
Intellectual property rights 453,573 405,848
Others 370,293 371,516
₩
891,268
₩
787,249
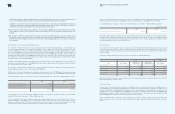
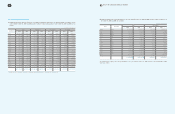
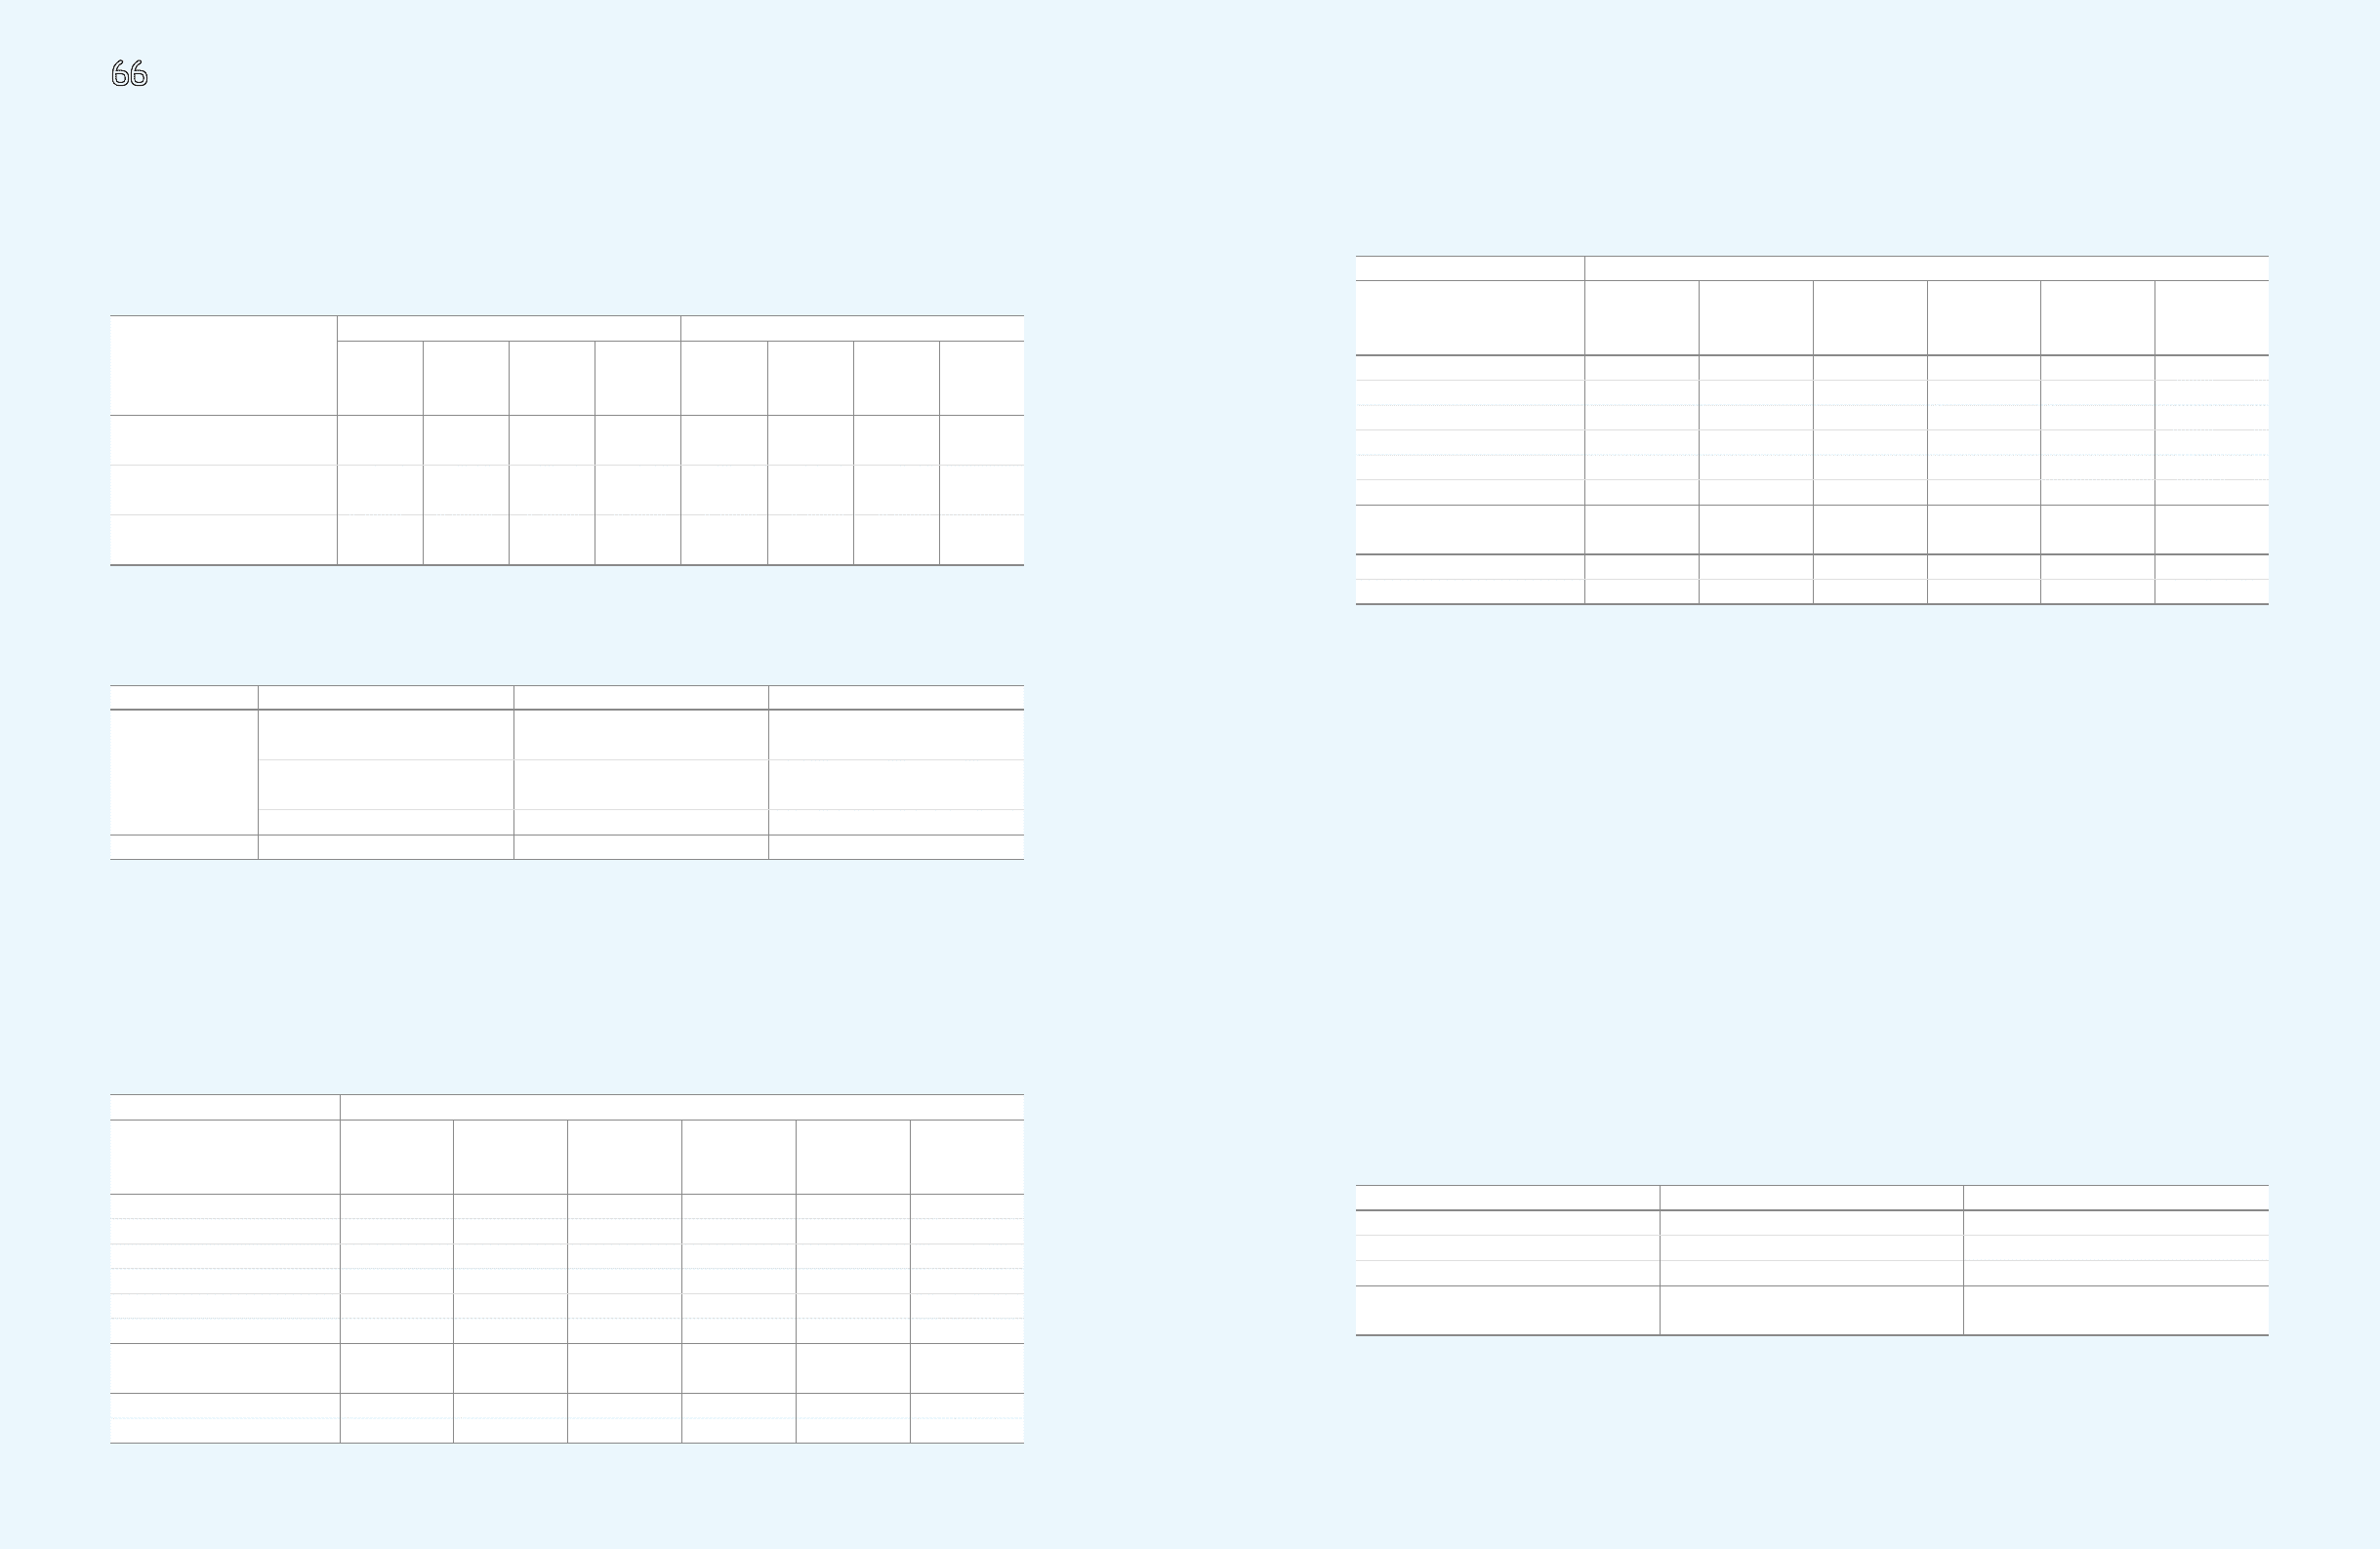
Share of equity-method investees’ other comprehensive income or loss as of December 31, 2009 and 2008, are as follows:
As of December 31, 2009, share of equity-method investees’ other comprehensive income and loss included the tax effect of
₩
73,920
million and
₩
615 million, respectively.
The Company has not applied the equity method of accounting on following investees:
1. Investments are excluded from the application of equity method of accounting because the Company does not have the ability to exercise significant
influence over the operating and financial policies, in accordance with the Monopoly Regulations and Fair Trade Law.
2. These investments are excluded from the application of equity-method of accounting because their total assets at the prior fiscal year end were less than
₩
10,000 million and movement in their net assets is immaterial.
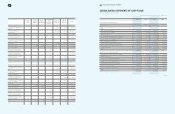
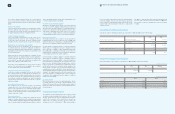
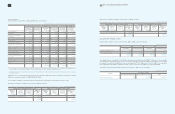
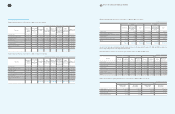
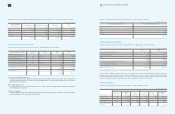
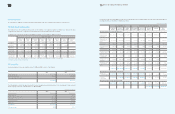
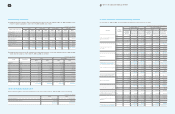
11. Property, Plant and Equipment
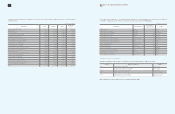
Changes in property, plant and equipment for the years ended December 31, 2009 and 2008, consist of the following:
(In millions of Korean won)
2009 2008
Balance at
January 1,
2009
Valuation
Amount
Included in
Earnings
Balance at
December
31, 2009
Balance at
January 1,
2008
Valuation
Amount
Included in
Earnings
Balance at
December
31, 2008
Share of equity-method investees’
other comprehensive income
₩
257,328
₩
104,588
₩
-
₩
361,916
₩
251,591
₩
5,737
₩
-
₩
257,328
Share of equity-method investees’
other comprehensive loss (13,441) 4,152 - (9,289) (8,017) (6,003) (579) (13,441)
₩
243,887
₩
108,740 -
₩
352,627
₩
243,574
₩
(266)
₩
(579)
₩
243,887
Location Subsidiaries Percentage of Ownership (%) Reason
Korea
Samsung Everland 1 25.6 Absence of significant influence
Allat 130.0 Absence of significant influence
International Cyber Marketing 245.0 Limited assets
Asia Future Technology & Service 228.6 Limited assets
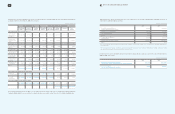
(In millions of Korean won)
2009
Land Buildings and
Structures
Machinery and
Equipment
Construction-
In-Progress/
Machinery-In-
Transit
Tools and
Vehicles Total
Balance at January 1, 2009
₩
3,212,092
₩
9,031,893
₩
24,027,462
₩
5,035,038
₩
1,189,826
₩
42,496,311
Acquisition 15,147 161,443 582,713 6,985,199 437,695 8,182,197
Transfer 99,835 1,358,145 7,094,380 (8,697,452) 145,092 -
Disposal (7,164) (41,984) (176,696) - (63,677) (289,521)
Depreciation (745,727) (9,499,813) - (665,803) (10,911,343)
Others 1 (13,562) 102,615 276,466 1,283 (28,459) 338,343
Balance at December 31, 2009
₩
3,306,348
₩
9,866,385
₩
22,304,512
₩
3,324,068
₩
1,014,674
₩
39,815,987
Acquisition cost 3,306,348 13,950,997 71,886,165 3,324,068 3,828,623 96,296,201
Accumulated depreciation - (4,084,612) (49,581,653) - (2,813,949) (56,480,214)
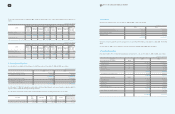
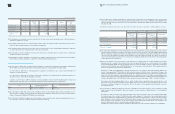
(In millions of Korean won)
(In millions of Korean won)
2008
Land Buildings and
Structures
Machinery and
Equipment
Construction-
In-Progress/
Machinery-In-
Transit
Tools and
Vehicles Total
Balance at January 1, 2008
₩
3,154,330
₩
7,800,158
₩
21,921,021
₩
3,354,428
₩
1,150,707
₩
37,380,644
Acquisition 22,094 265,853 1,062,701 12,269,006 455,975 14,075,629
Transfer 45,986 1,168,031 8,910,681 (10,297,439) 172,741 -
Disposal (58,705) (26,327) (95,609) - (65,249) (245,890)
Depreciation - (632,243) (8,616,476) - (606,810) (9,855,529)
Others 148,387 456,421 845,144 (290,957) 82,462 1,141,457
Balance at December 31, 2008
₩
3,212,092
₩
9,031,893
₩
24,027,462
₩
5,035,038
₩
1,189,826
₩
42,496,311
Acquisition cost 3,212,092 12,507,469 67,190,337 5,035,038 3,917,104 91,862,040
Accumulated depreciation - (3,475,576) (43,162,875) - (2,727,278) (49,365,729)