Samsung 2009 Annual Report Download - page 32
Download and view the complete annual report
Please find page 32 of the 2009 Samsung annual report below. You can navigate through the pages in the report by either clicking on the pages listed below, or by using the keyword search tool below to find specific information within the annual report.-
 1
1 -
2
-
3
-
4
-
5
-
6
-
7
-
8
-
9
-
10
-
11
-
12
-
13
-
14
-
15
-
16
-
17
-
18
-
19
-
20
-
21
-
 22
22 -
 23
23 -
 24
24 -
 25
25 -
 26
26 -
 27
27 -
 28
28 -
 29
29 -
 30
30 -
 31
31 -
 32
32 -
 33
33 -
 34
34 -
 35
35 -
 36
36 -
 37
37 -
 38
38 -
 39
39 -
 40
40 -
 41
41 -
 42
42 -
43
-
44
-
45
-
46
-
47
-
48
-
49
-
50
-
51
 |
 |
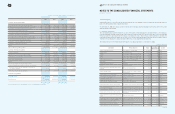
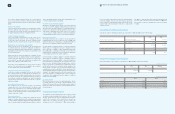
60 61 NOTES TO THE CONSOLIDATED FINANCIAL STATEMENTS
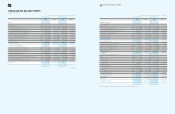
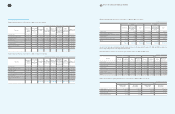
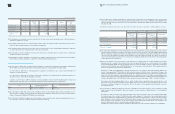
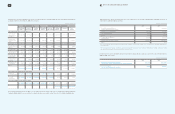
(1) Collection schedule of installment finance and general loans as of December 31, 2009, follows:
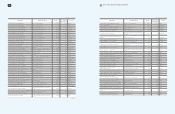
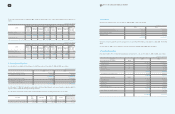
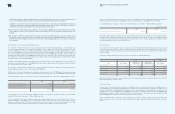
(2) Lease assets consist primarily of finance lease receivables and properties under operating leases.
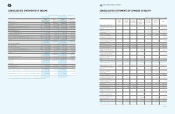
Maturities of finance leases, as of December 31, 2009 and 2008, are as follows:
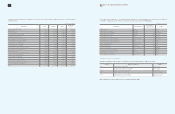
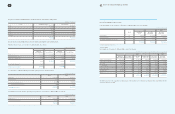
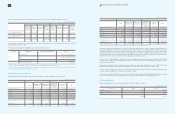
As of December 31, 2009 and 2008, properties under operating leases are classified as follows:
The minimum lease receipts relating to operating lease agreements as of December 31, 2009 and 2008, are as follows:
(In millions of Korean won)
Year Installment finance General loans
2010
₩
161,281
₩
175,470
2011 80,802 45,394
2012 54,458 33,637
2013 8,391 15,935
2014 3,690 4,717
Thereafter 176 617
₩
308,798
₩
275,770
(In millions of Korean won)
2009 2008
Minimum
Lease Payment Present Values Minimum
Lease Payment Present Values
Within one year
₩
129,454
₩
124,868
₩
29,973
₩
29,225
From one year to five years 191,725 163,656 438,904 385,848
Unguaranteed residual value 70,855 64,414 88,790 78,199
392,034
₩
352,938 557,667
₩
493,272
Present value adjustment (39,096) (64,395)
Finance lease receivables
₩
352,938
₩
493,272
(In millions of Korean won)
2009 2008
Automobiles
₩
768,821
₩
993,712
Electronic system 3,997 6,410
772,818 1,000,122
Less: Accumulated depreciation 324,430 315,471
Accumulated impairment losses 2,852 2,641
Operating lease assets
₩
445,536
₩
682,010
(In millions of Korean won)
2009 2008
Within one year
₩
168,731
₩
242,325
From one year to five years 68,973 212,272
₩
237,704
₩
454,597
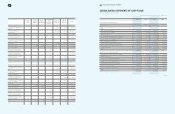
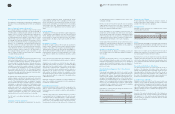
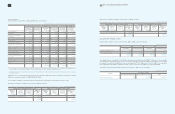
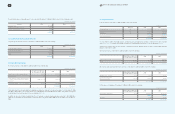
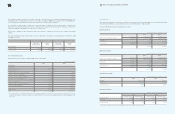
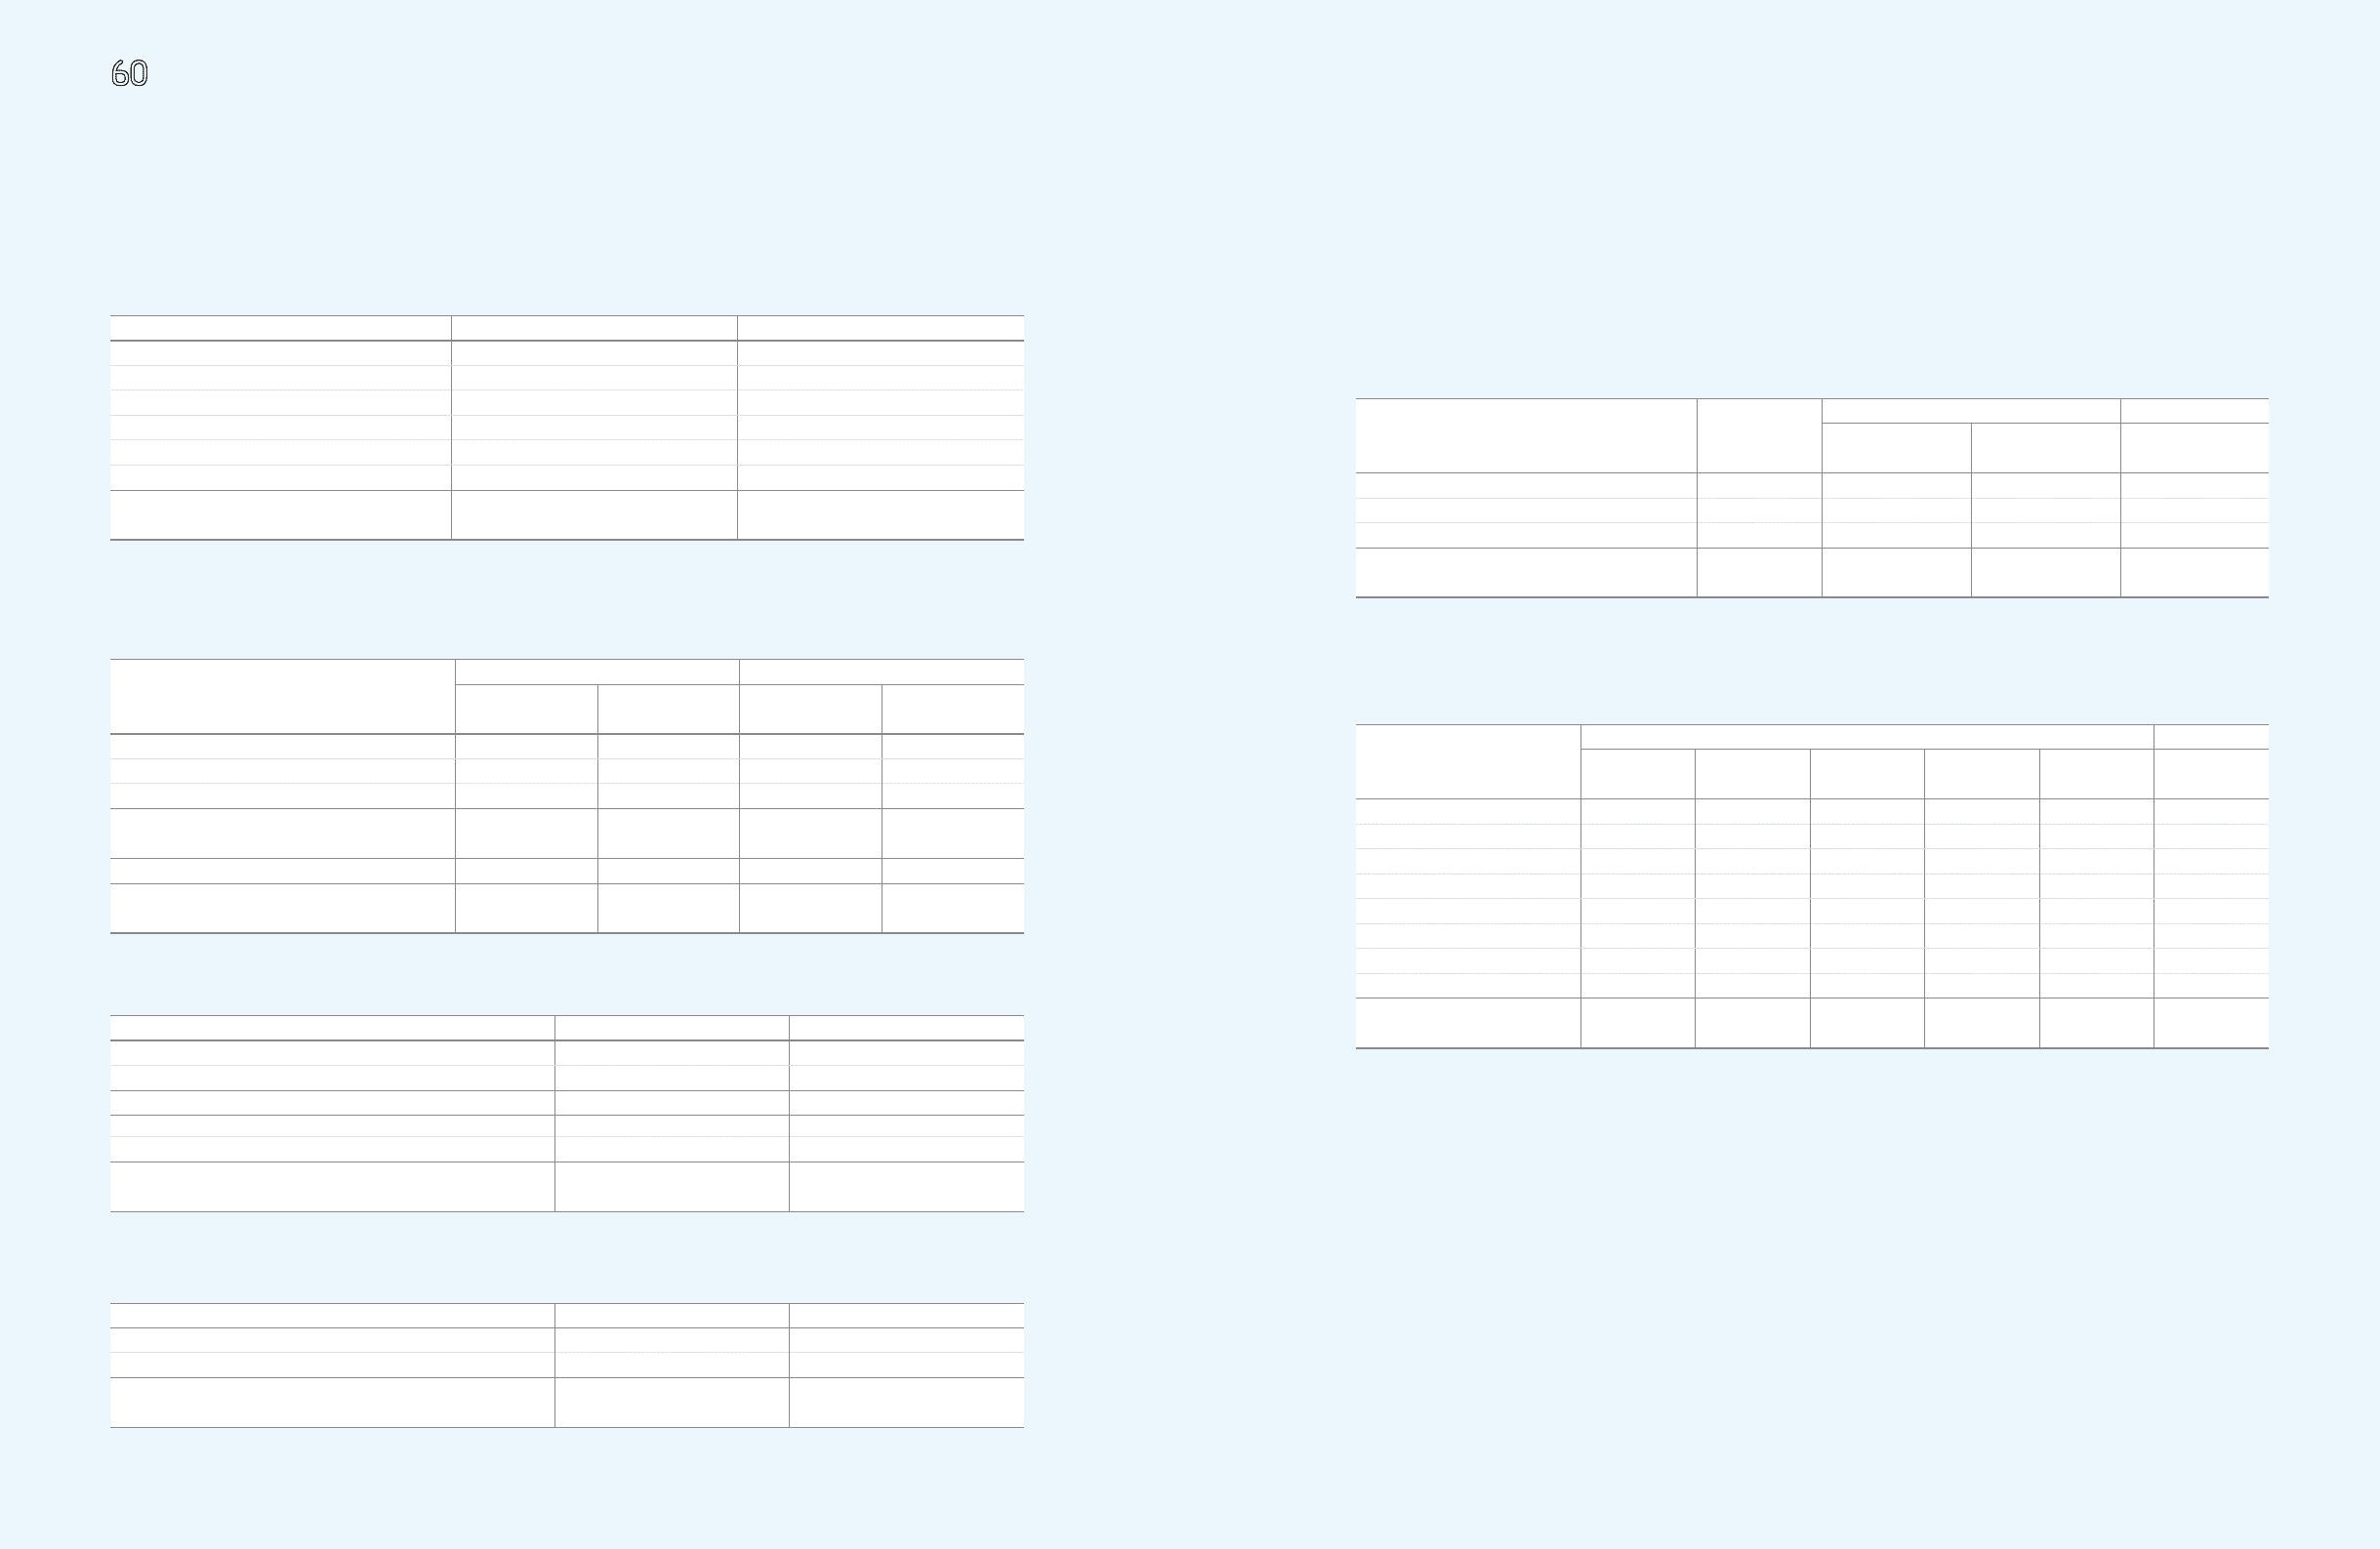
9. Long-Term Available-For-Sale Securities and Long-Term Held-To-Maturity Securities
(1) Long-Term Available-For-Sale Securities
Long-term available-for-sale securities as of December 31, 2009 and 2008, consist of the following:
1. Exclude equity-method investees.
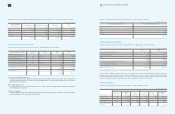
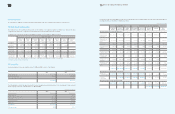
1) Listed equities
Listed equities as of December 31, 2009 and 2008, consist of the following:
The differences between the acquisition cost and fair value of the investment is recorded under accumulated other comprehensive income,
a separate component of equity.
(In millions of Korean won)
Detail
2009 2008
Acquisition
Cost
Recorded
Book Value
Recorded
Book Value
Listed equities 1(1)
₩
593,639
₩
2,234,339
₩
1,935,163
Non-listed equities 1(2) 411,661 644,468 679,602
Government and public bonds and others 31,706 31,706 3,497
₩
1,037,006
₩
2,910,513
₩
2,618,262
(In millions of Korean won, except for the number of shares and percentage)
2009 2008
Number of
Shares Owned
Percentage of
Ownership (%)
Acquisition
Cost
Market Value
of Investee
Recorded
Book Value
Recorded
Book Value
Samsung Heavy Industries 40,675,641 17.6
₩
258,299
₩
984,350
₩
984,350
₩
919,269
Samsung Fine Chemicals 2,969,730 11.5 61,374 139,726 139,726 114,186
Hotel Shilla 2,529,580 6.4 18,604 52,109 52,109 32,505
Cheil Worldwide 259,949 5.7 25,737 81,884 81,884 50,690
Samsung Fire & Marine Insurance 2,298,377 4.9 90,443 458,526 458,526 433,244
Samsung Securities 3,143,194 4.7 57,347 198,650 198,650 194,878
Cheil Industries 2,449,713 4.9 18,339 138,409 138,409 98,478
Others 63,496 180,685 180,685 91,913
₩
593,639
₩
2,234,339
₩
2,234,339
₩
1,935,163