Samsung 2009 Annual Report Download - page 41
Download and view the complete annual report
Please find page 41 of the 2009 Samsung annual report below. You can navigate through the pages in the report by either clicking on the pages listed below, or by using the keyword search tool below to find specific information within the annual report.-
 1
1 -
2
-
3
-
4
-
5
-
6
-
7
-
8
-
9
-
10
-
11
-
12
-
13
-
14
-
15
-
16
-
17
-
18
-
19
-
20
-
21
-
22
-
23
-
24
-
25
-
26
-
27
-
28
-
29
-
30
-
 31
31 -
 32
32 -
 33
33 -
 34
34 -
 35
35 -
 36
36 -
 37
37 -
 38
38 -
 39
39 -
 40
40 -
 41
41 -
 42
42 -
 43
43 -
 44
44 -
 45
45 -
 46
46 -
 47
47 -
 48
48 -
 49
49 -
 50
50 -
 51
51
 |
 |
78 79 NOTES TO THE CONSOLIDATED FINANCIAL STATEMENTS
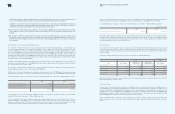
25. Treasury Stock
As of December 31, 2009, the Company holds 19,027,950 common shares and 2,979,693 preferred shares as treasury stocks.
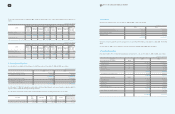
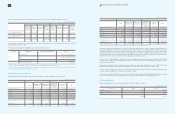
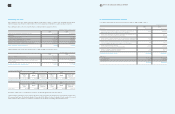
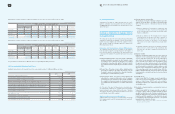
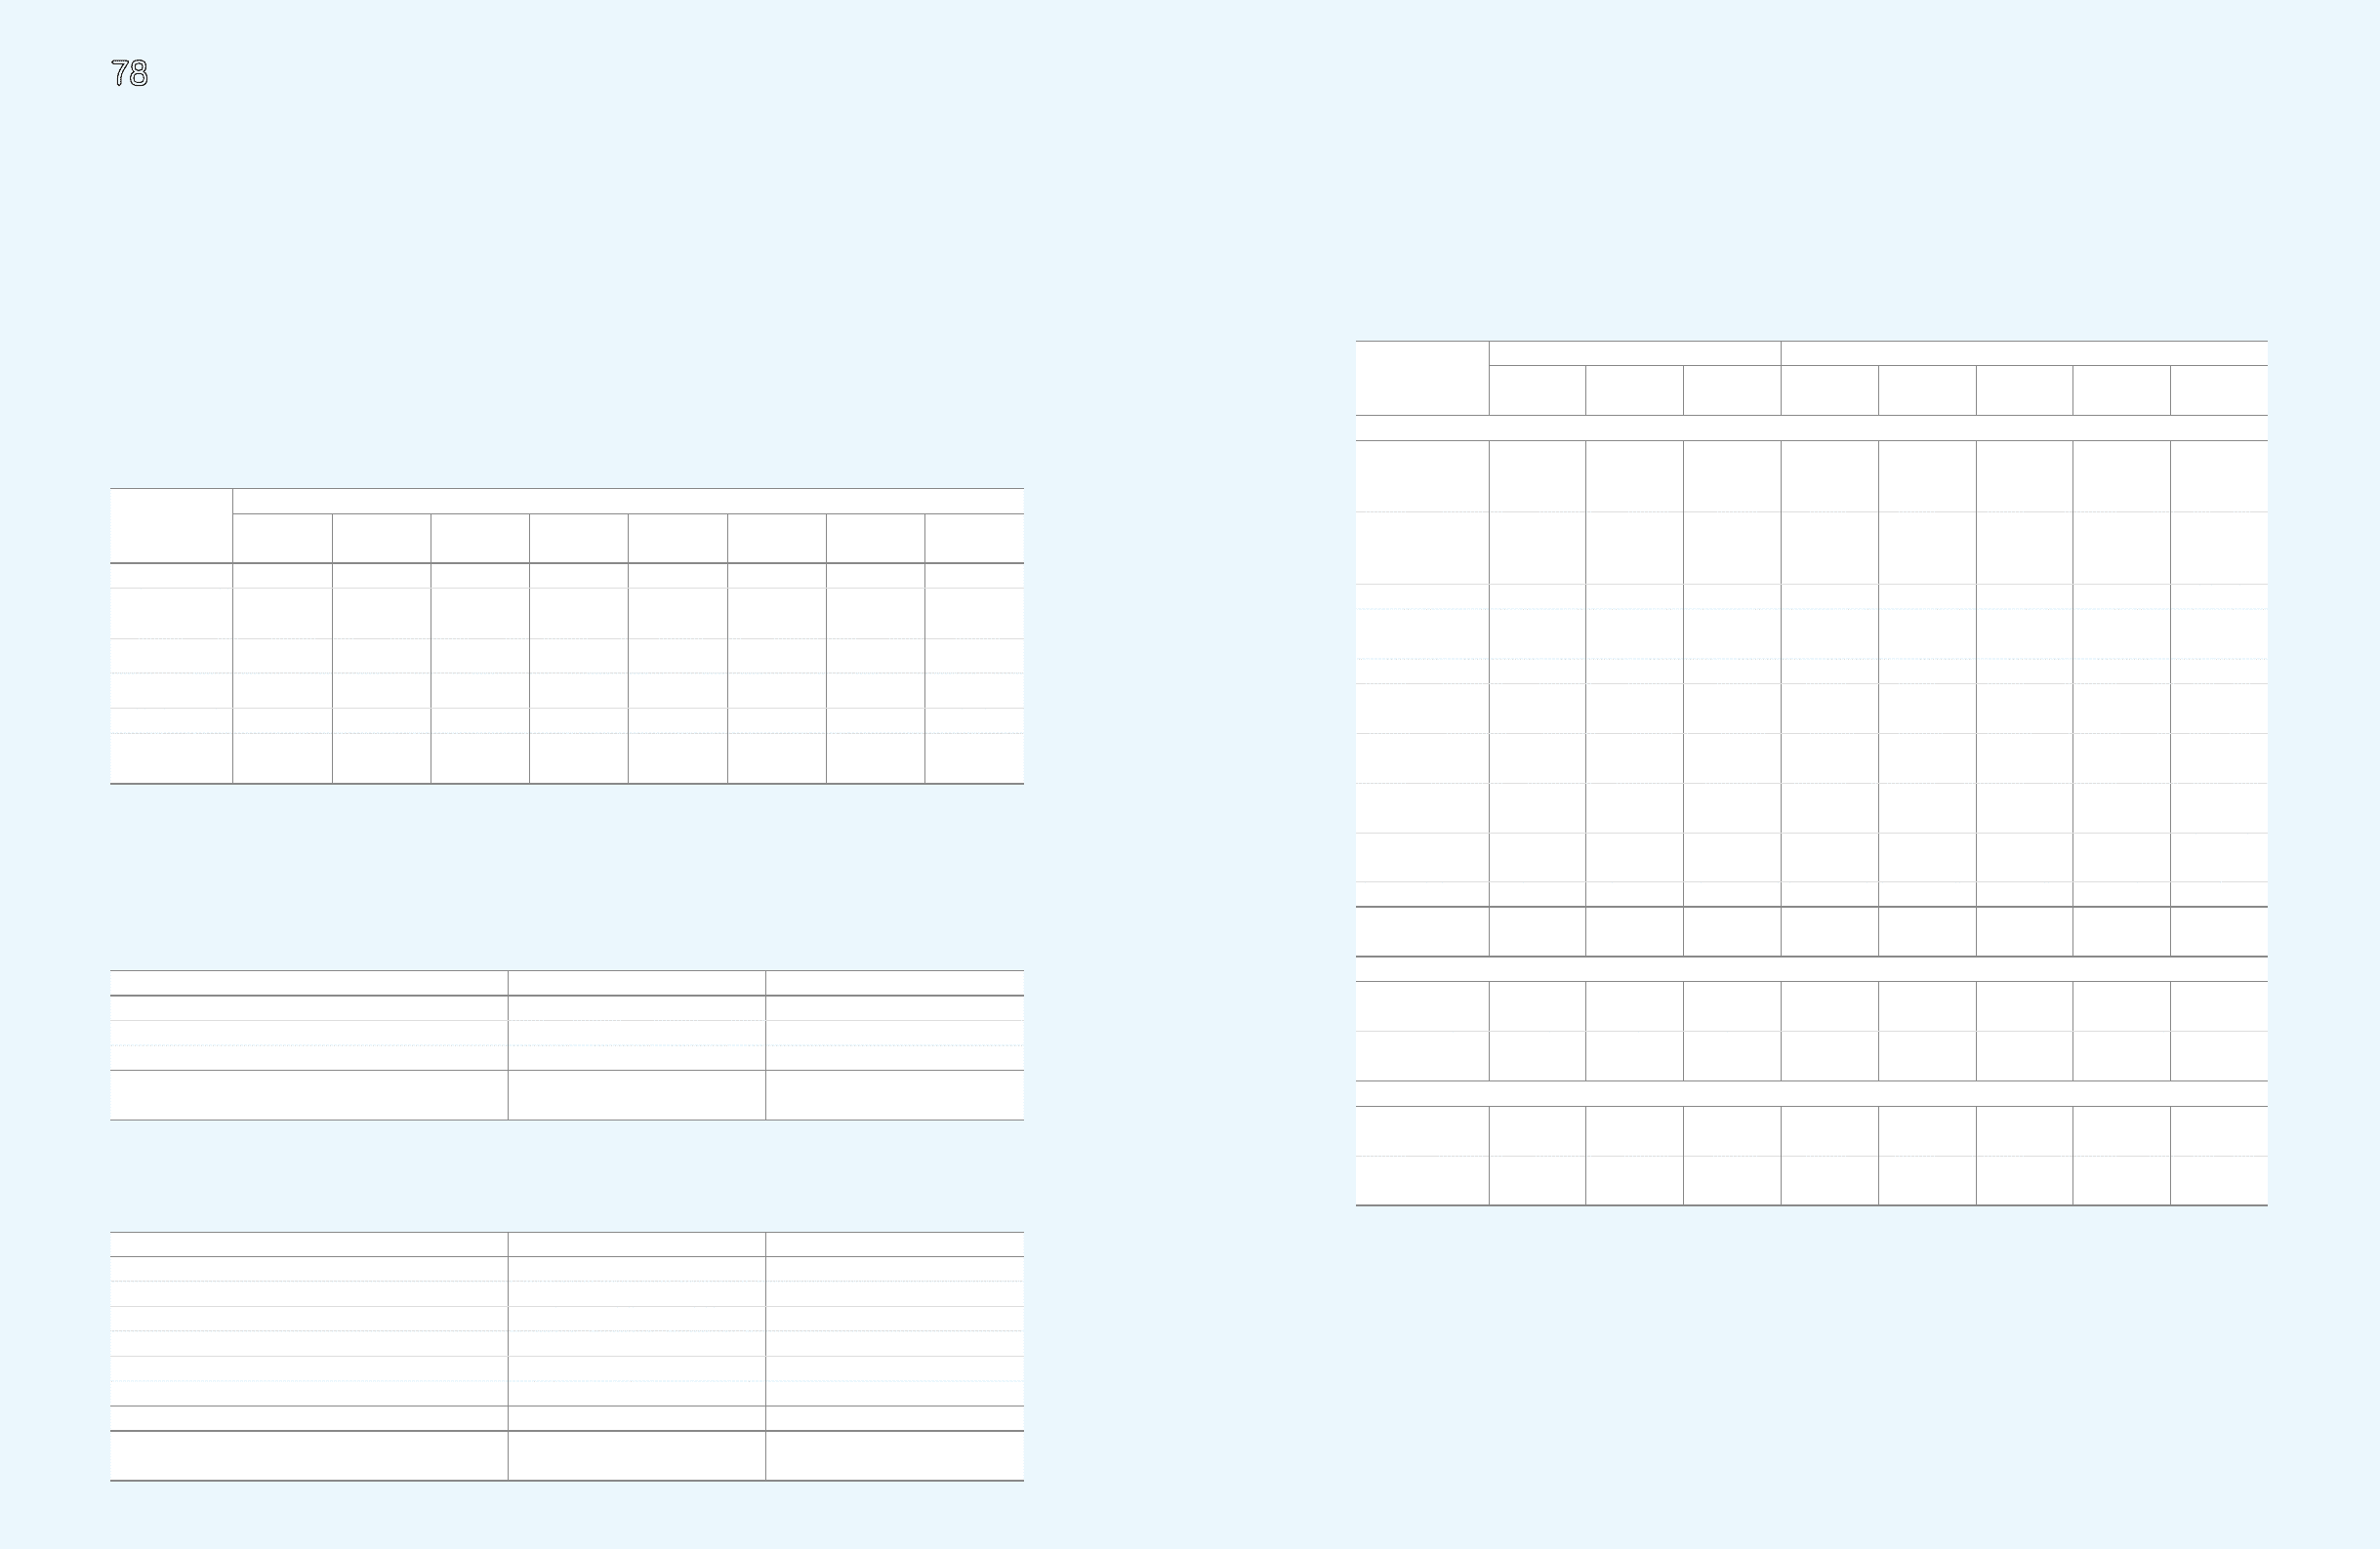
26. Stock-Based Compensation
The Company has a stock option plan that provides for the granting of stock purchase options to employees or directors who have
contributed or are expected to contribute to the management and technological innovation of the Company.
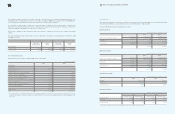
A summary of the terms and the number of outstanding stock options as of December 31, 2009 is as follows:
1. The exercise price can be adjusted in the case of the issuance of new shares, stock dividends, stock splits, or stock mergers.
2. All options currently in issue are fully vested.
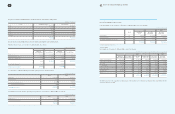
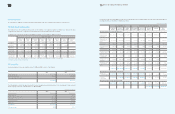
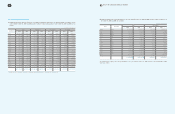
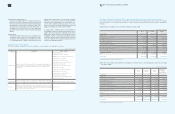
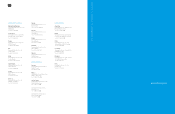
27. Income Tax
Income tax expense for the years ended December 31, 2009 and 2008, consists of the following:
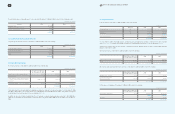
The following table reconciles the expected amount of income tax expense based on statutory rates to the actual amount of taxes recorded
by the Company for the years ended December 31, 2009 and 2008:
Date of the Grant
March 16,
2000
March 9,
2001
February 28,
2002
March 25,
2002
March 7,
2003
April 16,
2004
October 15,
2004
December 20,
2005
Total grants 1,500,000 3,099,500 988,000 121,000 368,100 590,000 10,000 10,000
Forfeitures and
exercises
prior to 2009
128,540
849,745
393,768
1,779,917
53,859
508,384
12,942
51,168
37,744
164,914
53,061
12,068
-
10,000
-
-
Exercised
during 2009 467,208 476,406 150,253 24,036 56,607 60,969 - -
Outstanding
stock options 54,507 449,409 275,504 32,854 108,835 463,902 - 10,000
Exercise price 1272,700 197,100 329,200 342,800 288,800 580,300 460,500 606,700
Exercise period
from the date
of the grant 2
2003.3.17~
2010.3.16
2004.3.10~
2011.3.9
2004.3.1~
2012.2.29
2004.3.26~
2012.3.25
2005.3.8~
2013.3.7
2006.4.17~
2014.4.16
2006.10.16~
2008.10.15
2007.12.21~
2015.12.20
2009 2008
Current income taxes
₩
2,070,999
₩
1,198,146
Deferred income taxes 261,136 (507,963)
Items charged directly to equity 2,994 (2,622)
₩
2,335,129
₩
687,561
2009 2008
Income before tax
₩
12,565,050
₩
6,577,775
Statutory tax rate 31.7% 32.9%
Expected taxes at statutory rate 3,982,749 2,161,473
Tax credit (801,854) (1,084,311)
Changes in tax rates (67,790) (34,444)
Others, net (777,976) (355,157)
Actual taxes
₩
2,335,129
₩
687,561
Effective tax rate 18.6% 10.5%
(In millions of Korean won)
(In millions of Korean won)
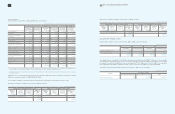
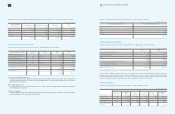
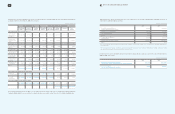
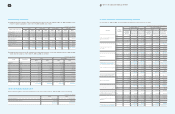
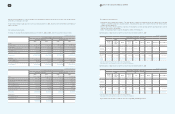
Deferred income tax assets and liabilities from tax effect of temporary differences including available tax credit carryforwards and undisposed
accumulated deficit as of December 31, 2009, are as follows:
(In millions of Korea won)
Temporary Differences Deferred Income Tax Asset (Liabilities)
Beginning
Balance
Increase
(Decrease)
Ending
Balance
Beginning
Balance
Increase
(Decrease)
Ending
Balance Current Non-
Current
Deferred tax arising from temporary differences
Special reserves
appropriated for
tax purposes
₩ (
1,282,294)
₩
637,483
₩
(644,811)
₩
(296,129)
₩
140,085
₩
(156,044)
₩
(156,044)
₩
-
Equity-method
investments and
others
(5,222,534) (3,809,948) (9,032,482) (596,130) (350,286) (946,416) - (946,416)
Depreciation (58,463) 32,049 (26,414) (54,503) 1,004 (53,499) 22,373 (75,872)
Capitalized interest
Expense (44,027) 2,365 (41,662) (9,685) (699) (10,384) (682) (9,702)
Accrued income (223,605) 184,037 (39,568) (54,064) 44,488 (9,576) (9,576) -
Allowance(technical
expense, others) 3,326,258 552,867 3,879,125 846,053 123,636 969,689 161,835 807,854
Deferred foreign
exchange gains 28,402 (27,195) 1,207 7,520 (7,011) 509 (1,519) 2,028
Foreign currency
translation 486,833 (361,269) 125,564 115,933 (86,868) 29,065 29,065 -
Impairment losses
on investments 516,958 (45,036) 471,922 113,823 (373) 113,450 105,882 7,568
Others 1,850,816 710,125 2,560,941 522,253 190,382 712,635 638,739 73,896
₩
(621,656)
₩
(2,124,522)
₩
(2,746,178)
₩
595,071
₩
54,358
₩
649,429
₩
790,073
₩
(140,644)
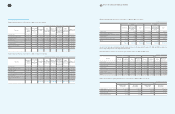
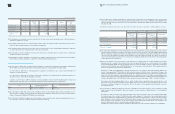
Deferred tax assets arising from the carryforwards
Undisposed
accumulated deficit
₩
2,453,416
₩
(899,119)
₩
1,554,297
₩
178,951
₩
(139,040) 39,911 20,003 19,908
Tax credit
carryforwards
₩
1,342,115
₩
168,034
₩
1,510,149
₩
933,544
₩
122,990 1,056,534 1,005,604 50,930
Deferred tax relating to items charged to equity
₩
(5,177,894)
₩
374,515
₩
(4,803,379)
₩
(682,172)
₩
42,261 (639,911) (179,467) (460,444)
₩
1,105,963
₩
1,636,213
₩
(530,250)