Samsung 2009 Annual Report Download - page 24
Download and view the complete annual report
Please find page 24 of the 2009 Samsung annual report below. You can navigate through the pages in the report by either clicking on the pages listed below, or by using the keyword search tool below to find specific information within the annual report.
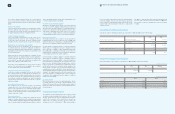
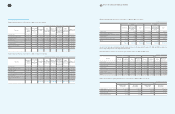
44 45 CONSOLIDATED FINANCIAL STATEMENTS
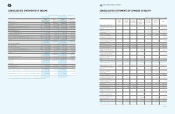
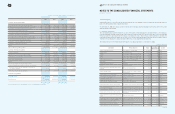
CONSOLIDATED STATEMENTS OF INCOME
Years Ended December 31, 2009 and 2008
(In millions of Korean won and in thousands of U.S. dollars (Note 3))
2008 2008
Sales (Note 31) 121,294,319 $ 103,936,863
Cost of sales (Note 31) 89,762,355 76,917,185
Gross profit 31,531,964 27,019,678
Selling, general and administrative expenses 25,500,101 21,850,986
Operating profit 6,031,863 5,168,692
Non-operating income
Interest and dividend income 639,439 547,934
Foreign exchange gains 7,238,637 6,202,774
Gain on foreign currency translation (Note 33) 444,663 381,031
Gain on valuation of equity method investments (Note 10) 1,047,224 897,364
Others 1,454,307 1,246,193
10,824,270 9,275,296
Non-operating expenses
Interest expense 670,271 574,354
Foreign exchange losses 7,597,640 6,510,403
Loss on foreign currency translation (Note 33) 933,940 800,291
Loss on valuation of equity method investments (Note 10) 209,357 179,398
Others 867,150 743,060
10,278,358 8,807,506
Net income before income tax 6,577,775 5,636,482
Income tax (Note 27) 687,561 589,169
Net income
₩
5,890,214 $ 5,047,313
Attributable to :
Controlling interests 5,525,904 4,735,136
Minority interests 364,310 312,177
Basic earnings per share (Note 28) (in Korean won and U.S. dollars)
₩
37,684 $ 32.29
Diluted earnings per share (Note 28) (in Korean won and U.S. dollars)
₩
37,340 $ 32.00
The accompanying notes are an integral part of these consolidated financial statements.
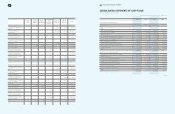
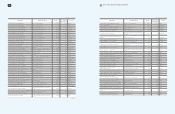
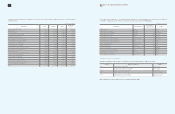
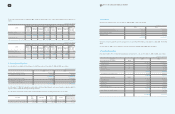
CONSOLIDATED STATEMENTS OF CHANGES IN EQUITY
For the Years Ended December 31, 2009 and 2008
(In millions of Korean won, in thousands of U.S. dollars)
Capital
Stock
Capital
Surplus
Capital
Adjustments
Accumulated
Other
Comprehensive
Income
Retained
Earnings
Minority
Interests Total
Balance at January 1, 2008
₩
897,514
₩
6,574,995
₩
(8,747,381)
₩
1,875,385
₩
51,065,174
₩
4,306,221
₩
55,971,908
Cash dividends appropriated in
prior year - - - - (1,098,098) (102,138) (1,200,236)
Retained earnings after
appropriations - - - - 49,967,076 4,204,083 54,771,672
Interim cash dividends - - - - (73,411) (41,839) (115,250)
Change in ownership interests,
including new stock issues by
consolidated subsidiaries
- 37,370 - - - 221,516 258,886
Cumulative effects of changes in
scope of consolidation - - - - - (318) (318)
Net income - - - - 5,525,904 364,310 5,890,214
Disposal of treasury stock - 4,039 247,357 - - - 251,396
Stock option activities - 2,306 (89,239) - - - (86,933)
Market value adjustments for
available-for-sale securities, net - - - (578,674) - (121,288) (699,962)
Change in share of equity method
investees accumulated other
comprehensive income, net
- - - 313 - - 313
Translation of foreign currency
financial statements - - - 2,527,591 - 207,537 2,735,128
Others - (29,849) (7,750) (16,539) 2 (27,056) (81,192)
Balance at December 31, 2008
₩
897,514
₩
6,588,861
₩
(8,597,013)
₩
3,808,076
₩
55,419,571
₩
4,806,945
₩
62,923,954
Balance at January 1, 2008 $ 769,078 $ 5,634,100 $ (7,495,614) $ 1,607,015 $ 43,757,647 $ 3,689,992 $ 47,962,218
Cash dividends appropriated in
prior year - - - - (940,958) (87,522) (1,028,480)
Retained earnings after
appropriations - - - - 42,816,689 3,602,470 46,933,738
Interim cash dividends - - - - (62,906) (35,851) (98,757)
Change in ownership interests,
including new stock issues by
consolidated subsidiaries
- 32,022 - - - 189,817 221,839
Cumulative effects of changes in
scope of consolidation - - - - - (272) (272)
Net income - - - - 4,735,136 312,177 5,047,313
Disposal of treasury stock - 3,461 211,960 - - - 215,421
Stock option activities - 1,976 (76,469) - - - (74,493)
Market value adjustments for
available-for-sale securities, net - - - (495,865) - (103,931) (599,796)
Change in share of equity method
investees accumulated other
comprehensive income, net
- - - 268 - - 268
Translation of foreign currency
financial statements - - - 2,165,888 - 177,838 2,343,726
Others - (25,577) (6,641) (14,173) 2 (23,186) (69,575)
Balance at December 31, 2008 $ 769,078 $ 5,645,982 $ (7,366,764) $ 3,263,133 $ 47,488,921 $ 4,119,062 $ 53,919,412
continued
2009
₩
138,993,671
98,945,032
40,048,639
28,470,988
11,577,651
427,983
7,694,732
1,322,276
1,522,171
1,216,196
12,183,358
546,524
8,154,660
1,054,106
121,702
1,318,967
11,195,959
12,565,050
2,335,129
₩
10,229,921
9,649,487
580,434
₩
65,499
₩
65,194
2009
$ 119,103,403
84,785,803
34,317,600
24,396,734
9,920,866
366,738
6,593,601
1,133,056
1,304,345
1,042,156
10,439,896
468,315
6,987,712
903,261
104,286
1,130,221
9,593,795
10,766,967
2,000,968
$ 8,765,999
8,268,626
497,373
$ 56.13
$ 55.86


