Samsung 2009 Annual Report Download - page 23
Download and view the complete annual report
Please find page 23 of the 2009 Samsung annual report below. You can navigate through the pages in the report by either clicking on the pages listed below, or by using the keyword search tool below to find specific information within the annual report.-
 1
1 -
2
-
3
-
4
-
5
-
6
-
7
-
8
-
9
-
10
-
11
-
12
-
 13
13 -
 14
14 -
 15
15 -
 16
16 -
 17
17 -
 18
18 -
 19
19 -
 20
20 -
 21
21 -
 22
22 -
 23
23 -
 24
24 -
 25
25 -
 26
26 -
 27
27 -
 28
28 -
 29
29 -
 30
30 -
 31
31 -
 32
32 -
 33
33 -
34
-
35
-
36
-
37
-
38
-
39
-
40
-
41
-
42
-
43
-
44
-
45
-
46
-
47
-
48
-
49
-
50
-
51
 |
 |
CONSOLIDATED FINANCIAL STATEMENTS
43
42
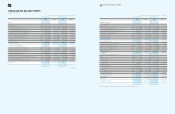
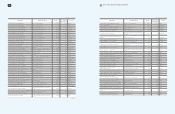
CONSOLIDATED BALANCE SHEETS
December 31, 2009 and 2008
(In millions of Korean won and in thousands of U.S. dollars (Note 3))
2008 2008
Assets
Current assets
Cash and cash equivalents
₩
8,814,638 $ 7,553,246
Short-term financial instruments (Note 4) 3,591,337 3,077,410
Short-term available-for-sale securities (Note 5) 982,067 841,531
Trade accounts and notes receivable (Note 6) 12,043,979 10,320,462
Other accounts and notes receivable (Note 6) 1,558,279 1,335,286
Short-term financing receivables (Note 8) 6,266,512 5,369,762
Prepaid expenses and other current assets 4,084,069 3,499,630
Deferred income tax assets (Note 27) 2,135,068 1,829,536
Inventories (Note 7) 9,492,607 8,134,196
Total current assets 48,968,556 41,961,059
Property, plant and equipment,
net of accumulated depreciation (Note 11) 42,496,311 36,415,005
Long-term available-for-sale securities (Note 9) 2,618,262 2,243,584
Long-term held-to-maturity securities (Note 9) 334,460 286,598
Equity-method investments (Note 10) 4,356,862 3,733,386
Deferred income tax assets (Note 27) 379,087 324,839
Intangible assets, net of accumulated amortization (Note 12) 787,249 674,592
Long-term financing receivables (Note 8) 3,704,792 3,174,629
Long-term deposits and other assets (Note 13) 1,655,071 1,418,227
Total assets
₩
105,300,650 $ 90,231,919
(In millions of Korean won and in thousands of U.S. dollars (Note 3))
2008 2008
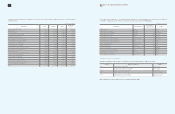
Liabilities and Equity
Current liabilities
Trade accounts and notes payable
₩
5,587,137 $ 4,787,607
Short-term borrowings (Note 14) 9,026,630 7,734,901
Current maturities of long-term debts (Notes 15 and 16) 2,263,380 1,939,486
Other accounts and notes payable 5,114,567 4,382,662
Accrued expenses (Note 18) 7,907,197 6,775,662
Income taxes payable 675,553 578,880
Other current liabilities 1,632,606 1,398,977
Total current liabilities 32,207,070 27,598,175
Long-term debts (Note 15) 5,773,957 4,947,692
Foreign currency notes and bonds (Note 16) 390,693 334,784
Long-term accrued expenses (Note 18) 177,774 152,334
Accrued severance benefits (Note 17) 850,233 728,563
Deferred income tax liabilities (Note 27) 1,486,287 1,273,596
Other long-term liabilities 1,490,682 1,277,363
Total liabilities 42,376,696 36,312,507
Commitments and contingencies (Note 19)
Equity
Capital stock (Note 22)
Preferred stock
₩
119,467 $ 102,371
Common stock 778,047 666,707
Capital surplus 6,588,861 5,645,982
Capital adjustments
Treasury stock (Note 25) (8,910,135) (7,635,077)
Others 313,122 268,313
Accumulated other comprehensive income (Note 29) 3,808,076 3,263,133
Retained earnings (Note 23) 55,419,571 47,488,921
Total Shareholders’ equity 58,117,009 49,800,350
Minority interests 4,806,945 4,119,062
Total equity 62,923,954 53,919,412
Total liabilities & equity
₩
105,300,650 $ 90,231,919
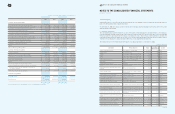
The accompanying notes are an integral part of these consolidated financial statements.
continued
2009
₩
10,835,893
8,629,742
2,104,420
17,061,397
2,079,161
5,891,568
3,847,062
1,638,887
9,981,064
62,069,194
39,815,987
2,910,513
314,933
5,523,913
345,475
891,268
2,754,543
3,655,662
₩
118,281,488
2009
$ 9,285,255
7,394,809
1,803,273
14,619,877
1,781,629
5,048,473
3,296,541
1,404,359
8,552,754
53,186,970
34,118,241
2,494,013
269,865
4,733,430
296,037
763,726
2,360,362
3,132,530
$ 101,355,174
2009
₩
8,234,318
7,613,518
3,127,998
5,920,420
9,056,596
1,124,171
2,642,120
37,719,141
3,545,012
124,183
383,273
827,805
875,725
1,752,057
45,227,196
₩
119,467
778,047
6,652,110
(8,404,791)
149,132
3,272,533
64,261,204
66,827,702
6,226,590
73,054,292
₩
118,281,488
2009
$ 7,055,971
6,524,009
2,680,375
5,073,196
7,760,579
963,300
2,264,028
32,321,458
3,037,714
106,412
328,426
709,344
750,407
1,501,334
38,755,095
$ 102,371
666,707
5,700,180
(7,202,049)
127,791
2,804,227
55,065,299
57,264,526
5,335,553
62,600,079
$ 101,355,174