Samsung 2009 Annual Report Download - page 44
Download and view the complete annual report
Please find page 44 of the 2009 Samsung annual report below. You can navigate through the pages in the report by either clicking on the pages listed below, or by using the keyword search tool below to find specific information within the annual report.-
 1
1 -
2
-
3
-
4
-
5
-
6
-
7
-
8
-
9
-
10
-
11
-
12
-
13
-
14
-
15
-
16
-
17
-
18
-
19
-
20
-
21
-
22
-
23
-
24
-
25
-
26
-
27
-
28
-
29
-
30
-
31
-
32
-
33
-
 34
34 -
 35
35 -
 36
36 -
 37
37 -
 38
38 -
 39
39 -
 40
40 -
 41
41 -
 42
42 -
 43
43 -
 44
44 -
 45
45 -
 46
46 -
 47
47 -
 48
48 -
 49
49 -
 50
50 -
 51
51
 |
 |
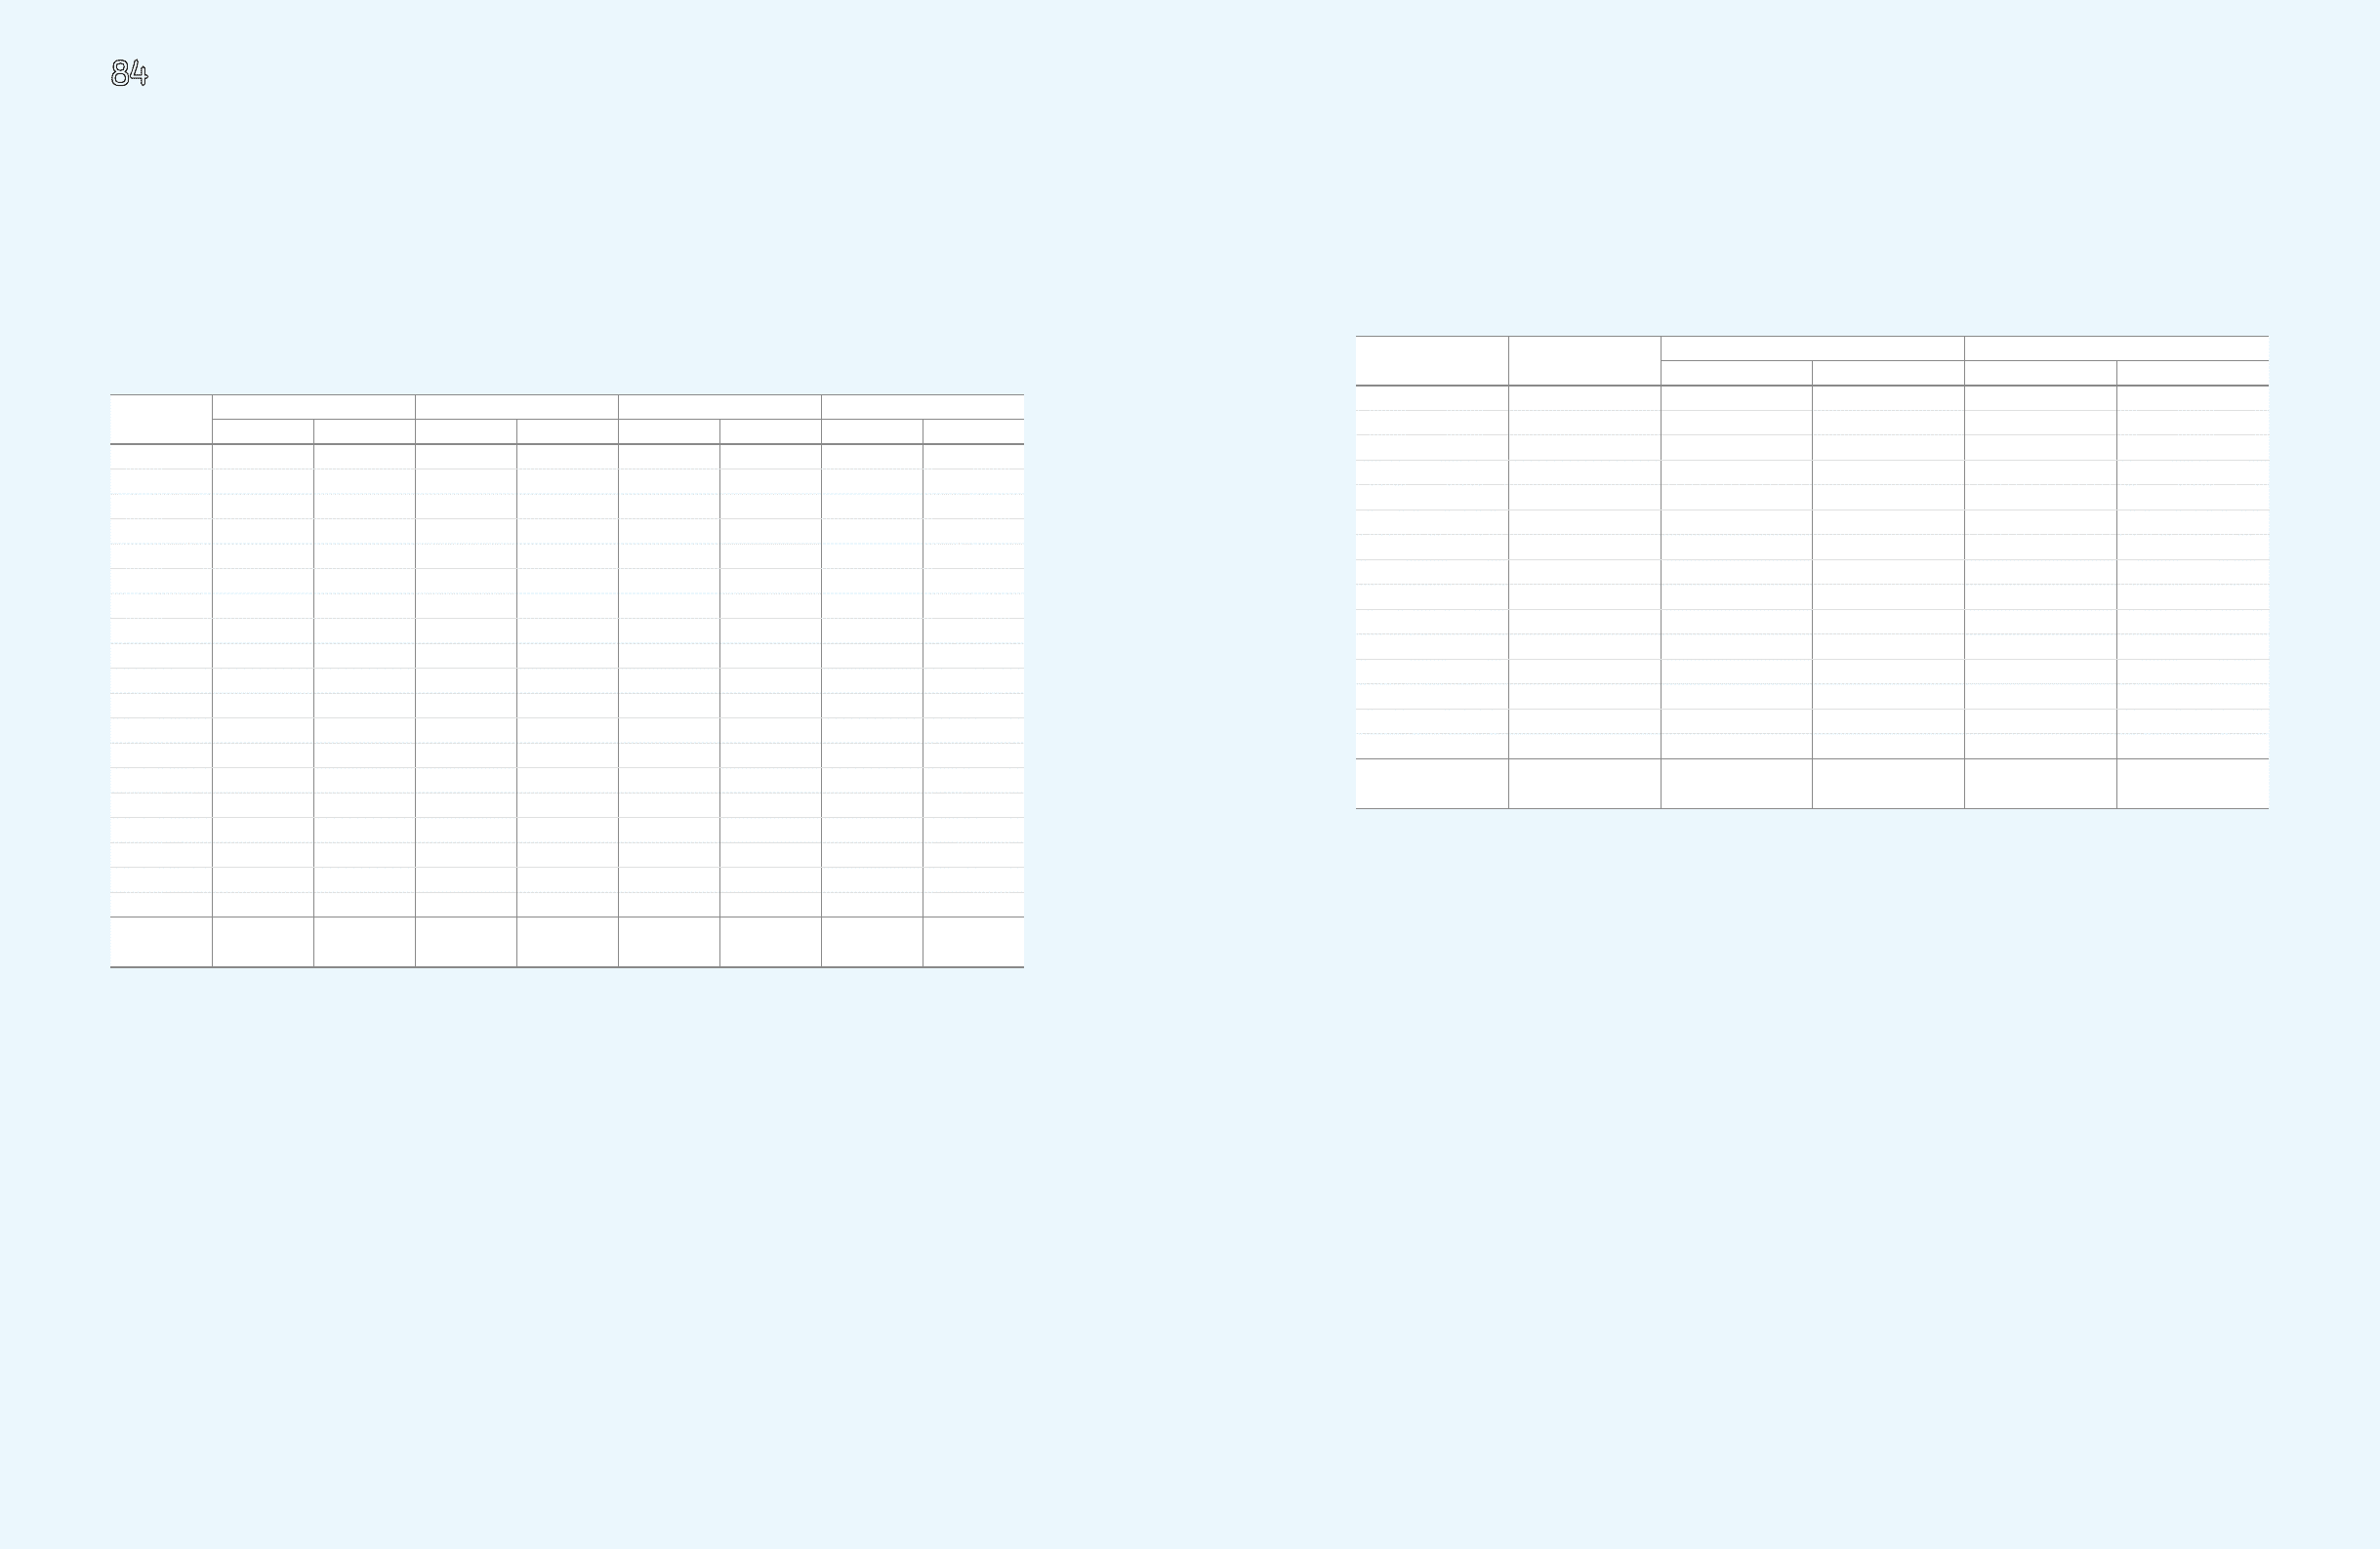
84 85 NOTES TO THE CONSOLIDATED FINANCIAL STATEMENTS
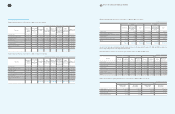
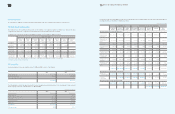
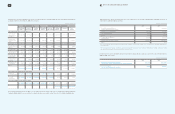
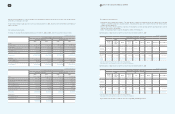
30. Inter-Company transactions
(A) Significant transactions between SEC and its consolidated subsidiaries, which have been eliminated during consolidation, for the
years ended December 31, 2009 and 2008, and the related receivables and payables as of December 31, 2009 and 2008, are as
follows:
1. Include the sale of subsidiaries’ receivables to third party financial institutions as of December 31, 2009 and 2008.
(In millions of Korean won)
Subsidiaries Sales Purchases Receivables 1 Payables
2009 2008 2009 2008 2009 2008 2009 2008
SJC
₩
4,229,962
₩
4,315,405
₩
2,045,651
₩
2,506,250
₩
159,842
₩
93,210
₩
123,835
₩
48,672
SLCD 2,489,354 2,056,610 5,906,870 3,879,111 774,249 861,718 593,445 295,930
STA 8,275,115 5,137,179 912,532 785,536 577,532 462,437 355,703 329,555
SET 6,300,109 5,495,042 1,230,643 943,183 563,481 212,309 64,460 5,811
SSI 8,633,887 6,666,062 58,036 48,213 837,738 561,770 71,469 15,458
SAPL 2,494,314 1,811,626 1,120,078 999,342 167,703 72,209 73,580 16,833
SEHK 3,643,168 2,684,351 2,057,119 1,416,165 232,550 292,780 138,677 7,130
SEA 1,689,291 1,090,980 3,187,784 2,375,123 290,861 24,773 232,836 68,949
SSEG 5,850,129 5,347,442 870,779 6,483 684,120 547,879 101,030 -
SEHZ 1,076,746 568,112 3,567,206 55,261 151,959 56,060 767,680 19,413
SEUK 2,035,465 1,687,522 331,034 291,741 74,842 30,794 97,698 100,428
SEF 1,801,689 1,556,652 120,963 99,795 187,314 163,232 50,368 33,204
SSEL 1,124,174 1,311,566 1,429 10,735 175,917 97,717 973 574
SII 1,585,445 737,947 4,002 5,507 45,856 63,881 52 1,141
SEI 887,363 578,121 91,911 131,800 32,000 10,628 38,142 61,078
SELS 718,100 561,185 3,339 9,393 256,101 123,956 701 196
TSTC 1,676,091 2,432,163 2,540,838 1,122,679 296,480 160,086 565,312 67,646
SESC 267,288 163,915 2,639,786 529,438 31,050 24,257 224,866 55,793
Others 21,584,340 14,973,998 12,653,424 11,295,168 3,679,961 2,077,204 1,861,506 1,545,259
₩
76,362,030
₩
59,175,878
₩
39,343,424
₩
26,510,923
₩
9,219,556
₩
5,936,900
₩
5,362,333
₩
2,673,070
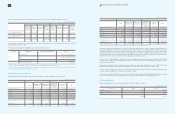
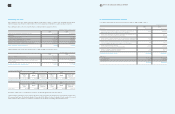
(B) Significant transactions among subsidiaries for the years ended December 31, 2009 and 2008, and the related receivables as of
December 31, 2009 and 2008, are as follows:
The significant intercompany loans among subsidiaries for the year ended December 31, 2009, amount to
₩
3,419,430 million (2008:
₩
3,414,022 million).
(In millions of Korean won)
Seller Purchaser Sales Receivables
2009 2008 2009 2008
SESK SELS
₩
5,406,374
₩
4,832,457
₩
402,097
₩
396,408
SII SEA 6,174,400 5,117,141 243,860 8,142
SHE SELS 3,904,125 2,656,769 283,539 162,888
SELS SEUK 1,736,763 1,602,037 26,420 11,523
SELS SEF 1,582,988 1,427,862 26,593 13,414
SSI SII 2,014,021 2,087,497 78,761 105,602
SET SII 1,176,432 981,694 98,082 31,363
SSEG SESK 1,438,256 1,437,963 140,164 159,960
SET SESK 1,042,903 1,041,481 80,092 5,536
TSED SCIC 745,296 556,563 60,214 55,270
SET SEH 903,207 1,073,728 90,988 9,902
SELS SEG 1,712,109 1,203,847 71,954 46,878
SELS SEI 1,408,536 1,131,029 31,145 8,986
SET TSED 367,217 721,469 25,992 16,983
Others 36,272,207 31,267,766 4,264,193 3,385,936
₩
65,884,834
₩
57,139,303
₩
5,924,094
₩
4,418,791