Royal Caribbean Cruise Lines 2014 Annual Report Download - page 91
Download and view the complete annual report
Please find page 91 of the 2014 Royal Caribbean Cruise Lines annual report below. You can navigate through the pages in the report by either clicking on the pages listed below, or by using the keyword search tool below to find specific information within the annual report.
90 Royal Caribbean Cruises Ltd.
NOTES TO THE CONSOLIDATED FINANCIAL STATEMENTS
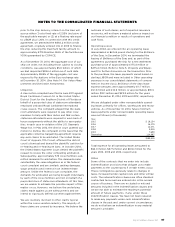
The reported fair values are based on a variety of
factors and assumptions. Accordingly, the fair values
may not represent actual values of the financial instru-
ments that could have been realized as of December
31, 2014 or December 31, 2013, or that will be realized
in the future, and do not include expenses that could
be incurred in an actual sale or settlement.
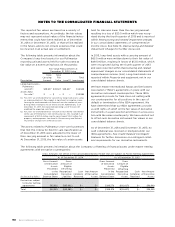
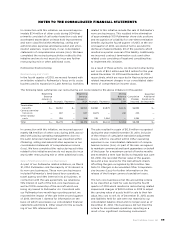
The following table presents information about the
Company’s long-lived assets for our Pullmantur
reporting unit and assets held for sale recorded at
fair value on a nonrecurring basis (in thousands):
Fair Value Measurements at
December 31, 2013 Using
Description
Total
Carrying
Amount
Total
Fair
Value Level 3
Total
Impairment
Long-lived assets—
Pullmantur
aircraft()
Assets held
for sale() — — —
() For 2013, we estimated the fair value of our long-lived assets using
an undiscounted cash flow model. A significant assumption in per-
forming the undiscounted cash flow test was the number of years
during which we expect to use these aircraft. Additionally, as of
December 31, 2013, the expected operating use of the aircraft
modified the expected cash flows.
() For 2013, we estimated the fair value of assets held for sale related
to the sale of Pullmantur’s non-core businesses. This resulted in an
impairment of $20.0 million mostly consisting of $18.2 million for
property and equipment. See Note 16. Restructuring and Related
Impairment Charges for further discussion.
The assets related to Pullmantur’s non-core businesses
that met the criteria for held for sale classification as
of December 31, 2013 were adjusted to the lower of
their carrying amount or fair value less cost to sell.
At December 31, 2013, the fair value of certain assets
held for sale was lower than the carrying amount,
resulting in a loss of $20.0 million which was recog-
nized during the fourth quarter of 2013 and is reported
within Restructuring and related impairment charges
in our consolidated statements of comprehensive
income (loss). See Note 16. Restructuring and Related
Impairment Charges for further discussion.
In 2013, long-lived assets with a carrying amount of
$63.0 million were written down to their fair value of
$49.5 million, resulting in losses of $13.5 million, which
were recognized during the fourth quarter of 2013
and were reported within Restructuring and related
impairment charges in our consolidated statements of
comprehensive income (loss). Long-lived assets are
reported within Property and equipment, net in our
consolidated balance sheets.
We have master International Swaps and Derivatives
Association (“ISDA”) agreements in place with our
derivative instrument counterparties. These ISDA
agreements provide for final close out netting with
our counterparties for all positions in the case of
default or termination of the ISDA agreement. We
have determined that our ISDA agreements provide
us with rights of setoff on the fair value of derivative
instruments in a gain position and those in a loss posi-
tion with the same counterparty. We have elected not
to offset such derivative instrument fair values in our
consolidated balance sheets.
As of December 31, 2014 and December 31, 2013, no
cash collateral was received or pledged under our
ISDA agreements. See Credit Related Contingent
Features for further discussion on contingent collat-
eral requirements for our derivative instruments.
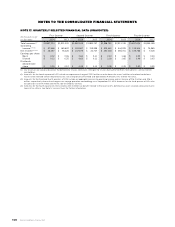
The following table presents information about the Company’s offsetting of financial assets under master netting
agreements with derivative counterparties:
Gross Amounts not Offset in the Consolidated Balance Sheet that are Subject to Master Netting Agreements
As of December 31, 2014 As of December 31, 2013
(In thousands of dollars)
Gross Amount
of Derivative
Assets
Presented
in the
Consolidated
Balance Sheet
Gross
Amount of
Eligible
Offsetting
Recognized
Derivative
Liabilities
Cash
Collateral
Received
Net Amount
of Derivative
Assets
Gross Amount
of Derivative
Assets
Presented
in the
Consolidated
Balance Sheet
Gross
Amount of
Eligible
Offsetting
Recognized
Derivative
Assets
Cash
Collateral
Received
Net Amount
of Derivative
Assets
Derivatives subject
to master netting
agreements () — — () —
Total () — — () —


