Royal Caribbean Cruise Lines 2014 Annual Report Download - page 87
Download and view the complete annual report
Please find page 87 of the 2014 Royal Caribbean Cruise Lines annual report below. You can navigate through the pages in the report by either clicking on the pages listed below, or by using the keyword search tool below to find specific information within the annual report.-
 1
1 -
2
-
3
-
4
-
5
-
6
-
7
-
8
-
9
-
10
-
11
-
12
-
13
-
14
-
15
-
16
-
17
-
18
-
19
-
20
-
21
-
22
-
23
-
24
-
25
-
26
-
27
-
28
-
29
-
30
-
31
-
32
-
33
-
34
-
35
-
36
-
37
-
38
-
39
-
40
-
41
-
42
-
43
-
44
-
45
-
46
-
47
-
48
-
49
-
50
-
51
-
52
-
53
-
54
-
55
-
56
-
57
-
58
-
59
-
60
-
61
-
62
-
63
-
64
-
65
-
66
-
67
-
68
-
69
-
70
-
71
-
72
-
73
-
74
-
75
-
76
-
 77
77 -
 78
78 -
 79
79 -
 80
80 -
 81
81 -
 82
82 -
 83
83 -
 84
84 -
 85
85 -
 86
86 -
 87
87 -
 88
88 -
 89
89 -
 90
90 -
 91
91 -
 92
92 -
 93
93 -
 94
94 -
 95
95 -
 96
96 -
 97
97 -
98
-
99
-
100
-
101
-
102
-
103
-
104
 |
 |

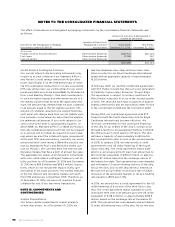
86 Royal Caribbean Cruises Ltd.
NOTES TO THE CONSOLIDATED FINANCIAL STATEMENTS
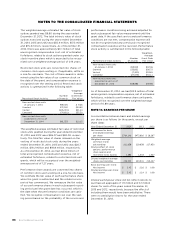
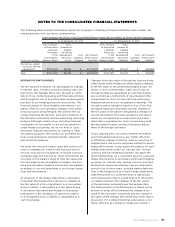
The weighted-average estimated fair value of stock
options granted was $9.90 during the year ended
December 31, 2012. The total intrinsic value of stock
options exercised during the years ended December
31, 2014, 2013 and 2012 was $35.9 million, $17.5 million
and $15.3 million, respectively. As of December 31,
2014, there was approximately $0.1 million of total
unrecognized compensation cost, net of estimated
forfeitures, related to stock options granted under our
stock incentive plans which is expected to be recog-
nized over a weighted-average period of 0.14 years.
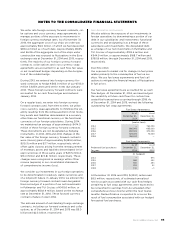
Restricted stock units are converted into shares of
common stock upon vesting or, if applicable, settle on
a one-for-one basis. The cost of these awards is deter-
mined using the fair value of our common stock on
the date of the grant, and compensation expense is
recognized over the vesting period. Restricted stock
activity is summarized in the following table:
Restricted Stock Activity
Number
of Awards
Weighted-
Average
Grant Date
Fair Value
Non-vested share units
at January 1, 2014
Granted
Vested ()
Canceled ()
Non-vested share units
expected to vest as of
December 31, 2014
The weighted-average estimated fair value of restricted
stock units granted during the year ended December
31, 2013, and 2012 were $36.07 and $30.03, respec-
tively. The total fair value of shares released on the
vesting of restricted stock units during the years
ended December 31, 2014, 2013 and 2012 was $20.7
million, $19.2 million and $18.8 million, respectively.
As of December 31, 2014, we had $14.6 million of
total unrecognized compensation expense, net of
estimated forfeitures, related to restricted stock unit
grants, which will be recognized over the weighted-
average period of 1.27 years.
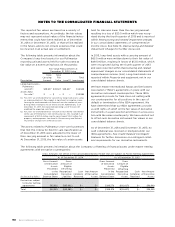
Performance share awards are converted into shares
of common stock upon vesting on a one-for-one basis.
We estimate the fair value of each performance share
when the grant is authorized and the related service
period has commenced. We remeasure the fair value
of our performance shares in each subsequent report-
ing period until the grant date has occurred, which is
the date when the performance conditions are satis-
fied. We recognize compensation cost over the vest-
ing period based on the probability of the service and
performance conditions being achieved adjusted for
each subsequent fair value measurement until the
grant date. If the specified service and performance
conditions are not met, compensation expense will
not be recognized and any previously recognized
compensation expense will be reversed. Performance
stock activity is summarized in the following table:
Performance Stock Activity
Number
of Awards
Weighted-
Average
Grant Date
Fair Value
Non-vested share units
at January 1, 2014
Granted
Vested ()
Canceled ()
Non-vested share units
expected to vest as of
December 31, 2014
As of December 31, 2014, we had $12.9 million of total
unrecognized compensation expense, net of estimated
forfeitures, related to performance share unit grants,
which will be recognized over the weighted-average
period of 0.89 years.
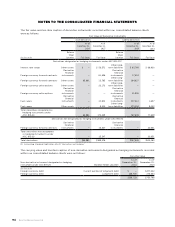
NOTE 10. EARNINGS PER SHARE
A reconciliation between basic and diluted earnings
per share is as follows (in thousands, except per
share data):
Year Ended December 31,
Net income for basic
and diluted earnings
per share
Weighted-average
common shares
outstanding
Dilutive effect of stock
options, performance
share awards and
restricted stock awards
Diluted weighted-average
shares outstanding
Basic earnings per share:
Net income
Diluted earnings per share:
Net income
Diluted earnings per share did not reflect options to
purchase an aggregate of 1.9 million and 3.1 million
shares for each of the years ended December 31,
2013 and 2012, respectively, because the effect of
including them would have been antidilutive. There
were no antidilutive shares for the year ended
December 31, 2014.