Royal Caribbean Cruise Lines 2014 Annual Report Download - page 55
Download and view the complete annual report
Please find page 55 of the 2014 Royal Caribbean Cruise Lines annual report below. You can navigate through the pages in the report by either clicking on the pages listed below, or by using the keyword search tool below to find specific information within the annual report.-
 1
1 -
2
-
3
-
4
-
5
-
6
-
7
-
8
-
9
-
10
-
11
-
12
-
13
-
14
-
15
-
16
-
17
-
18
-
19
-
20
-
21
-
22
-
23
-
24
-
25
-
26
-
27
-
28
-
29
-
30
-
31
-
32
-
33
-
34
-
35
-
36
-
37
-
38
-
39
-
40
-
41
-
42
-
43
-
44
-
 45
45 -
 46
46 -
 47
47 -
 48
48 -
 49
49 -
 50
50 -
 51
51 -
 52
52 -
 53
53 -
 54
54 -
 55
55 -
 56
56 -
 57
57 -
 58
58 -
 59
59 -
 60
60 -
 61
61 -
 62
62 -
 63
63 -
 64
64 -
 65
65 -
66
-
67
-
68
-
69
-
70
-
71
-
72
-
73
-
74
-
75
-
76
-
77
-
78
-
79
-
80
-
81
-
82
-
83
-
84
-
85
-
86
-
87
-
88
-
89
-
90
-
91
-
92
-
93
-
94
-
95
-
96
-
97
-
98
-
99
-
100
-
101
-
102
-
103
-
104
 |
 |

54 Royal Caribbean Cruises Ltd.
PART II
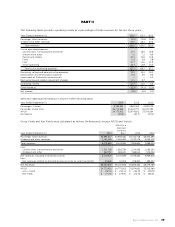
Other expense decreased $41.1 million, or 96.0%, to
$1.7 million in 2013 compared to $42.9 million for the
same period in 2012. This change was primarily due to:
• a $29.8 decrease in deferred income tax expense as
a result of a 100% valuation allowance recorded in
connection with Pullmantur’s deferred tax assets in
2012 partially offset by a reduction in Pullmantur’s
deferred tax liability and resulting tax benefit related
to a 2013 impairment of Pullmantur’s long-lived assets
and a 2012 impairment charge of Pullmantur’s trade-
marks and trade names; and
• income of $32.0 million from our equity method
investments in 2013 as compared to income of $23.8
million in 2012.
Net Yields
Net Yields increased 2.7% in 2013 compared to
2012 primarily due to an increase in ticket prices,
onboard revenue and Pullmantur’s travel agency
network and air charter business noted above. Net
Yields increased 3.2% in 2013 compared to 2012 on
a Constant Currency basis.
Net Cruise Costs
Net Cruise Costs increased 2.7% in 2013 compared to
2012 primarily due to the increase in crew expenses,
food expenses, indirect operating expenses and
expenses related to Pullmantur’s travel agency net-
work and air charter business, noted above. Net
Cruise Costs per APCD increased 1.9% in 2013 com-
pared to 2012. Net Cruise Costs per APCD on a
Constant Currency basis increased 1.7% in 2013 com-
pared to 2012.
Net Cruise Costs Excluding Fuel
Net Cruise Costs Excluding Fuel per APCD increased
2.1% in 2013 compared to 2012. Net Cruise Costs
Excluding Fuel per APCD on a Constant Currency
basis increased 1.8% in 2013 compared to 2012.
FUTURE APPLICATION OF ACCOUNTING STANDARDS
Refer to Note 2. Summary of Significant Accounting
Policies to our consolidated financial statements under
Item 8. Financial Statements and Supplementary
Data for further information on Recent Accounting
Pronouncements.
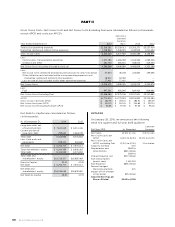
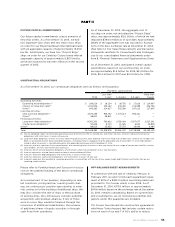
LIQUIDITY AND CAPITAL RESOURCES
Sources and Uses of Cash
Cash flow generated from operations provides us with
a significant source of liquidity. Net cash provided by
operating activities increased $331.7 million to $1.7
billion for 2014 compared to $1.4 billion for 2013. The
increase was primarily due to a decrease in interest
paid in 2014 compared to 2013 and the timing of
proceeds from accounts receivable and payments
to vendors in 2014. Net cash provided by operating
activities in 2013 remained consistent compared
to 2012.
Net cash used in investing activities was $1.8 billion for
2014 compared to $824.5 million for 2013. The increase
was primarily attributable to an increase in capital
expenditures of $1.0 billion in 2014 compared to 2013
primarily due to the delivery of Quantum of the Seas
and the purchase of Brilliance of the Seas in 2014.
Additionally, there was an increase in investments in
and loans to unconsolidated affiliates of $118.0 million
and an increase in cash paid on the settlement of
derivative financial instruments of $50.8 million.
These cash outlays were partially offset by cash
received of $220.0 million in 2014 for the sale of
Celebrity Century which did not occur in 2013 and a
$52.8 million increase in cash received from repay-
ments of a loan to an unconsolidated affiliate in 2014
compared to 2013.
Net cash used in investing activities was $824.5 million
for 2013 compared to $1.3 billion for 2012. The decrease
in 2013 compared to 2012 is primarily due to a decrease
in capital expenditures of $527.7 million attributable
to the delivery of a ship, Celebrity Reflection, in 2012
which did not recur in 2013, partially offset by a higher
level of ships under construction in 2013 compared
to 2012. The decrease in capital expenditures was
partially offset by investments of $70.6 million to
our unconsolidated affiliates during 2013.
Net cash provided by financing activities was $17.5
million for 2014 compared to net cash used in financ-
ing activities of $576.6 million for 2013. This change
was primarily due to a $1.7 billion increase in debt
proceeds and a $40.8 million increase in the proceeds
from the exercise of common stock options, partially
offset by the repurchase of treasury stock of $236.1
million, an increase of $867.7 million in repayments of
debt and an increase of dividends paid of $55.3 mil-
lion. The increase in repayments of debt and proceeds
from issuance of debt was primarily due to proceeds
received from an unsecured term loan of $791.1 million
due to the delivery of Quantum of the Seas in 2014, a
higher level of bond maturities and higher drawings
and repayments on our revolving credit facilities.
Net cash used in financing activities was $576.6 million
for 2013 compared to $179.6 million for 2012. This
change was primarily due to an increase of $295.2
million in repayments of debt and an increase of
$25.9 million paid in dividends, partially offset by a
decrease of $109.0 million in debt proceeds.