Royal Caribbean Cruise Lines 2014 Annual Report Download - page 54
Download and view the complete annual report
Please find page 54 of the 2014 Royal Caribbean Cruise Lines annual report below. You can navigate through the pages in the report by either clicking on the pages listed below, or by using the keyword search tool below to find specific information within the annual report.
Royal Caribbean Cruises Ltd. 53
PART II
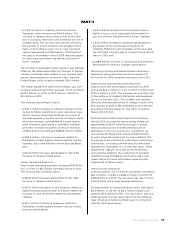
• a 0.8% increase in capacity, which increased
Passenger ticket revenues by $44.6 million. The
increase in capacity was primarily due to the addi-
tion of Celebrity Reflection which entered service in
October 2012. This increase was partially offset by
the transfer of Ocean Dream to an unrelated third-
party in April 2012 as part of a six-year bareboat
charter agreement and the transfer of Monarch of
the Seas to Pullmantur in April 2013 reducing capac-
ity due to the two-month lag further discussed in
Note 1. General.
The increase in passenger ticket revenues was partially
offset by the unfavorable effect of changes in foreign
currency exchange rates related to our revenue trans-
actions denominated in currencies other than the
United States dollar of approximately $34.1 million.
The remaining 28.1% of 2013 total revenues was com-
prised of Onboard and other revenues, which increased
$143.7 million, or 6.9%, to $2.2 billion in 2013 from
$2.1 billion in 2012.
The increase was primarily due to:
• a $101.7 million increase in onboard revenue primar-
ily due to higher spending on a per passenger basis
due to revenue enhancing initiatives as a result of
our ship upgrade programs and an increase in shore
excursion revenues attributable to certain deploy-
ment initiatives particularly in Australia. Onboard
and other revenues included concession revenues
of $316.3 million in 2013 and $288.6 million in 2012;
• a $28.3 million increase in revenues related to
Pullmantur’s travel agency network and air charter
business due to the addition of new tour packages;
and
• a $14.8 million increase attributable to the 0.8%
increase in capacity noted above.
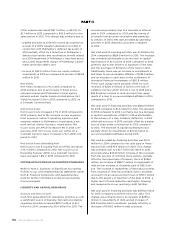
Cruise Operating Expenses
Total cruise operating expenses increased $147.8 mil-
lion, or 2.9%, to $5.3 billion from $5.2 billion in 2012.
The increase was primarily due to:
• a $39.6 million increase attributable to the 0.8%
increase in capacity noted above;
• a $22.6 million increase in crew expenses related to
higher medical expenses and, to a lesser extent, an
increase in crew movement related to deployment
changes;
• a $21.1 million increase in expenses related to
Pullmantur’s travel agency network and air charter
business noted above;
• a $16.4 million increase in food expenses due to
higher costs on a per passenger basis related to
our new culinary initiatives and itinerary changes;
• a $12.1 million increase in expenses attributable to
the impact of the unscheduled drydocks for
Celebrity Millennium and Grandeur of the Seas and
the 2012 gain from the sale of Oceanic which did not
recur in 2013; and
• an $8.6 million increase in shore excursion expenses
attributable to itinerary changes noted above.
Marketing, Selling and Administrative Expenses
Marketing, selling and administrative expenses of
$1.0 billion for 2013 remained consistent with 2012.
Depreciation and Amortization Expenses
Depreciation and amortization expenses for 2013
increased $24.2 million or 3.4% to $754.7 million from
$730.5 million in 2012. The increase was primarily due
to the addition of Celebrity Reflection which entered
service in October 2012. The increase was partially
offset by the favorable effect of changes made in the
first quarter of 2013 to the estimated useful lives and
associated residual values for five ships of approxi-
mately $11.0 million.
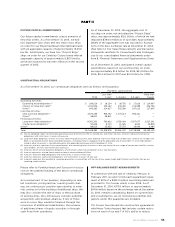
Restructuring and Related Impairment Charges
During 2013, we incurred restructuring charges of
approximately $23.4 million as a result of global
restructuring actions and the pending sale of
Pullmantur’s non-core businesses. In addition, we
recognized an impairment charge of $33.5 million
to write down the assets held for sale related to the
businesses to be sold and to write down certain long-
lived assets, consisting of three aircraft owned and
operated by Pullmantur Air, to their fair value. These
impairment charges were due to the Pullmantur
restructuring initiative. (See Valuation of Goodwill,
Indefinite-Lived Intangible Assets and Long-Lived
Assets above for more information regarding the
impairment of these assets).
Other Income (Expense)
Interest expense, net of interest capitalized, decreased
$23.4 million, or 6.6%, to $332.4 million in 2013 from
$355.8 million in 2012. The decrease was due to lower
interest rates and a lower average debt level.
Extinguishment of unsecured senior notes, decreased
$3.3 million, or 44.0%, to $4.2 million in 2013 com-
pared to $7.5 million in 2012. The decrease is due to a
lower amount of notes repurchased during 2013 par-
tially offset by a higher premium paid in connection
with the 2013 repurchases.


