Royal Caribbean Cruise Lines 2014 Annual Report Download - page 47
Download and view the complete annual report
Please find page 47 of the 2014 Royal Caribbean Cruise Lines annual report below. You can navigate through the pages in the report by either clicking on the pages listed below, or by using the keyword search tool below to find specific information within the annual report.-
 1
1 -
2
-
3
-
4
-
5
-
6
-
7
-
8
-
9
-
10
-
11
-
12
-
13
-
14
-
15
-
16
-
17
-
18
-
19
-
20
-
21
-
22
-
23
-
24
-
25
-
26
-
27
-
28
-
29
-
30
-
31
-
32
-
33
-
34
-
35
-
36
-
 37
37 -
 38
38 -
 39
39 -
 40
40 -
 41
41 -
 42
42 -
 43
43 -
 44
44 -
 45
45 -
 46
46 -
 47
47 -
 48
48 -
 49
49 -
 50
50 -
 51
51 -
 52
52 -
 53
53 -
 54
54 -
 55
55 -
 56
56 -
 57
57 -
58
-
59
-
60
-
61
-
62
-
63
-
64
-
65
-
66
-
67
-
68
-
69
-
70
-
71
-
72
-
73
-
74
-
75
-
76
-
77
-
78
-
79
-
80
-
81
-
82
-
83
-
84
-
85
-
86
-
87
-
88
-
89
-
90
-
91
-
92
-
93
-
94
-
95
-
96
-
97
-
98
-
99
-
100
-
101
-
102
-
103
-
104
 |
 |

46 Royal Caribbean Cruises Ltd.
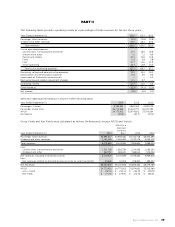
PART II
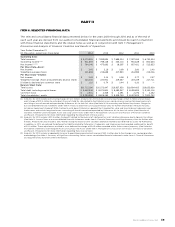
capital structure. A reconciliation of historical Debt-
to-Capital to Net Debt-to-Capital is provided below
under Results of Operations.
Net Revenues represent total revenues less commis-
sions, transportation and other expenses and onboard
and other expenses (each of which is described above
under the Description of Certain Line Items heading).
For the periods prior to the sale of the Pullmantur non-
core businesses, we have presented Net Revenues
excluding the estimated impact of these divested
businesses in the financial tables under Results of
Operations.
Net Yields represent Net Revenues per APCD. We
utilize Net Revenues and Net Yields to manage our
business on a day-to-day basis as we believe that it is
the most relevant measure of our pricing performance
because it reflects the cruise revenues earned by us
net of our most significant variable costs, which are
commissions, transportation and other expenses and
onboard and other expenses. A reconciliation of his-
torical Gross Yields to Net Yields is provided below
under Results of Operations. We have not provided a
quantitative reconciliation of projected Gross Yields
to projected Net Yields due to the significant uncer-
tainty in projecting the costs deducted to arrive at
this measure. Accordingly, we do not believe that rec-
onciling information for such projected figures would
be meaningful. For the periods prior to the sale of the
Pullmantur non-core businesses, Net Yields excludes
the estimated impact of these divested businesses.
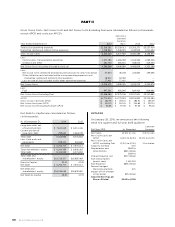
Occupancy, in accordance with cruise vacation
industry practice, is calculated by dividing Passenger
Cruise Days by APCD. A percentage in excess of 100%
indicates that three or more passengers occupied
some cabins.
Passenger Cruise Days represent the number of
passengers carried for the period multiplied by the
number of days of their respective cruises.
We believe Net Yields, Net Cruise Costs and Net Cruise
Costs Excluding Fuel are our most relevant non-GAAP
financial measures. However, a significant portion of
our revenue and expenses are denominated in curren-
cies other than the United States dollar. Because our
reporting currency is the United States dollar, the value
of these revenues and expenses can be affected by
changes in currency exchange rates. Although such
changes in local currency prices is just one of many
elements impacting our revenues and expenses, it
can be an important element. For this reason, we also
monitor Net Yields, Net Cruise Costs and Net Cruise
Costs Excluding Fuel as if the current periods’ cur-
rency exchange rates had remained constant with the
comparable prior periods’ rates, or on a “Constant
Currency” basis.
It should be emphasized that Constant Currency is
primarily used for comparing short-term changes
and/or projections. Over the longer term, changes in
guest sourcing and shifting the amount of purchases
between currencies can significantly change the impact
of the purely currency-based fluctuations.
The use of certain significant non-GAAP measures,
such as Net Yields, Net Cruise Costs and Net Cruise
Costs Excluding Fuel, allows us to perform capacity
and rate analysis to separate the impact of known
capacity changes from other less predictable changes
which affect our business. We believe these non-GAAP
measures provide expanded insight to measure reve-
nue and cost performance in addition to the standard
United States GAAP based financial measures. There
are no specific rules or regulations for determining
non-GAAP and Constant Currency measures, and as
such, there exists the possibility that they may not be
comparable to other companies within the industry.
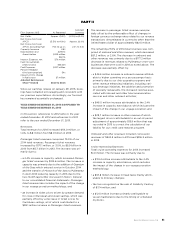
EXECUTIVE OVERVIEW
Midway through 2014, we announced our Double-
Double program, which called for increasing the
Company’s Return on Invested Capital (“ROIC”) to
double digits and doubling our 2014 Adjusted Earn-
ings per Share, both by 2017. Our aim, through this
program, is to provide shareholders with increased
visibility into our long-term financial goals by means
of a formalized and measured framework. To achieve
these goals, we maintain our focus on three key
objectives: growing revenue yields, maintaining cost
consciousness and pursuing moderate capacity growth.
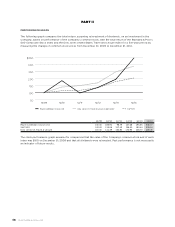
Our 2014 results were in line with our Double-Double
program. Based on our results, we remain confident
that we are on the right path for realizing these objec-
tives. We finished 2014 with net income of $764.1 mil-
lion, or $3.43 per diluted share, compared to $473.7
million, or $2.14 per diluted share, in 2013. Adjusted
Net Income was $755.7 million, or $3.39 per share,
compared to $539.2 million, or $2.44 per share, in
2013. Adjusted Earnings per Share of $3.39 per share
represented approximately a 40% increase in year-
over-year EPS growth and established a new record
for our Company.
Caribbean capacity for the industry grew by 13% in
2014 and comprised 49% of our total capacity. This
considerable growth led to increased levels of promo-
tional activity throughout the industry and depressed
our pricing power. Helping offset the Caribbean was
the double-digit yield improvement in Europe and
China. The European season was the strongest we
have seen in several years and China’s ability to absorb
our capacity growth while driving higher yields con-
tinues to impress.