Royal Caribbean Cruise Lines 2014 Annual Report Download - page 50
Download and view the complete annual report
Please find page 50 of the 2014 Royal Caribbean Cruise Lines annual report below. You can navigate through the pages in the report by either clicking on the pages listed below, or by using the keyword search tool below to find specific information within the annual report.-
 1
1 -
2
-
3
-
4
-
5
-
6
-
7
-
8
-
9
-
10
-
11
-
12
-
13
-
14
-
15
-
16
-
17
-
18
-
19
-
20
-
21
-
22
-
23
-
24
-
25
-
26
-
27
-
28
-
29
-
30
-
31
-
32
-
33
-
34
-
35
-
36
-
37
-
38
-
39
-
 40
40 -
 41
41 -
 42
42 -
 43
43 -
 44
44 -
 45
45 -
 46
46 -
 47
47 -
 48
48 -
 49
49 -
 50
50 -
 51
51 -
 52
52 -
 53
53 -
 54
54 -
 55
55 -
 56
56 -
 57
57 -
 58
58 -
 59
59 -
 60
60 -
61
-
62
-
63
-
64
-
65
-
66
-
67
-
68
-
69
-
70
-
71
-
72
-
73
-
74
-
75
-
76
-
77
-
78
-
79
-
80
-
81
-
82
-
83
-
84
-
85
-
86
-
87
-
88
-
89
-
90
-
91
-
92
-
93
-
94
-
95
-
96
-
97
-
98
-
99
-
100
-
101
-
102
-
103
-
104
 |
 |

Royal Caribbean Cruises Ltd. 49
PART II
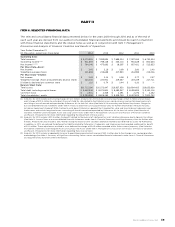
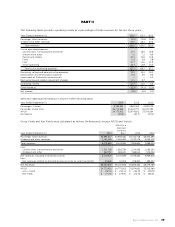
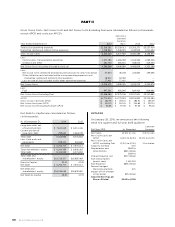
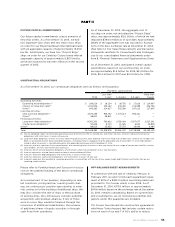
The following table presents operating results as a percentage of total revenues for the last three years:
Year Ended December 31,
Passenger ticket revenues
Onboard and other revenues
Total revenues
Cruise operating expenses:
Commissions, transportation and other
Onboard and other
Payroll and related
Food
Fuel
Other operating
Total cruise operating expenses
Marketing, selling and administrative expenses
Depreciation and amortization expenses
Impairment of Pullmantur related assets — —
Restructuring and related impairment charges —
Operating income
Other expense () () ()
Net income
Selected statistical information is shown in the following table:
Year Ended December 31,
Passengers Carried
Passenger Cruise Days
APCD
Occupancy
Gross Yields and Net Yields were calculated as follows (in thousands, except APCD and Yields):
Ona
Constant
Currency
Year Ended December 31, Basis
Passenger ticket revenues
Onboard and other revenues
Total revenues
Less:
Commissions, transportation and other
Onboard and other
Net revenues including divested businesses
Less:
Net revenues related to divested businesses prior to sales transaction
Net Revenues
APCD
Gross Yields
Net Yields