Royal Caribbean Cruise Lines 2014 Annual Report Download - page 86
Download and view the complete annual report
Please find page 86 of the 2014 Royal Caribbean Cruise Lines annual report below. You can navigate through the pages in the report by either clicking on the pages listed below, or by using the keyword search tool below to find specific information within the annual report.-
 1
1 -
2
-
3
-
4
-
5
-
6
-
7
-
8
-
9
-
10
-
11
-
12
-
13
-
14
-
15
-
16
-
17
-
18
-
19
-
20
-
21
-
22
-
23
-
24
-
25
-
26
-
27
-
28
-
29
-
30
-
31
-
32
-
33
-
34
-
35
-
36
-
37
-
38
-
39
-
40
-
41
-
42
-
43
-
44
-
45
-
46
-
47
-
48
-
49
-
50
-
51
-
52
-
53
-
54
-
55
-
56
-
57
-
58
-
59
-
60
-
61
-
62
-
63
-
64
-
65
-
66
-
67
-
68
-
69
-
70
-
71
-
72
-
73
-
74
-
75
-
 76
76 -
 77
77 -
 78
78 -
 79
79 -
 80
80 -
 81
81 -
 82
82 -
 83
83 -
 84
84 -
 85
85 -
 86
86 -
 87
87 -
 88
88 -
 89
89 -
 90
90 -
 91
91 -
 92
92 -
 93
93 -
 94
94 -
 95
95 -
 96
96 -
97
-
98
-
99
-
100
-
101
-
102
-
103
-
104
 |
 |

Royal Caribbean Cruises Ltd. 85
NOTES TO THE CONSOLIDATED FINANCIAL STATEMENTS
the performance target is return on invested capital
(“ROIC”) for the year ended December 31, 2014,
as adjusted by the Compensation Committee of our
Board of Directors for events that are outside of man-
agement’s control. In 2014, we issued a target number
of 233,831 performance shares which will vest on the
third anniversary of the award issue date. In February
2015, the Compensation Committee of our Board of
Directors set the actual payout level at 119% of target
for the performance shares issued in 2014.
We also provide an Employee Stock Purchase Plan
(“ESPP”) to facilitate the purchase by employees
of up to 1,300,000 shares of common stock in the
aggregate. Offerings to employees are made on a
quarterly basis. Subject to certain limitations, the pur-
chase price for each share of common stock is equal
to 85.0% of the average of the market prices of the
common stock as reported on the New York Stock
Exchange on the first business day of the purchase
period and the last business day of each month of the
purchase period. During 2014, 2013 and 2012, 26,921,
27,036 and 35,927 shares of our common stock were
issued under the ESPP at a weighted-average price
of $52.08, $33.16 and $25.58, respectively.
In 1994, we granted to our Chairman and Chief Execu-
tive Officer an award of common stock, issuable in
quarterly installments of 10,086 shares until the earlier
of the termination of his employment or June 2014. In
furtherance of this grant, we issued an aggregate of
40,344 shares of common stock in each of 2012 and
2013 and an aggregate of 20,172 shares of common
stock in 2014.
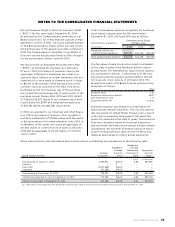
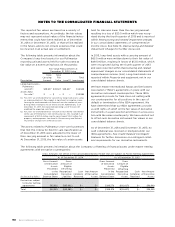
Total compensation expense recognized for employee
stock-based compensation for the years ended
December 31, 2014, 2013 and 2012 was as follows:
Classification of expense
Employee Stock-Based
Compensation
(In thousands)
Marketing, selling and
administrative expenses
Total compensation expense
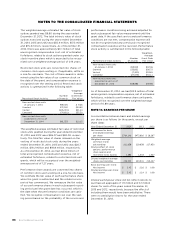
The fair value of each stock option grant is estimated
on the date of grant using the Black-Scholes option
pricing model. The estimated fair value of stock options,
less estimated forfeitures, is amortized over the vest-
ing period using the graded-vesting method. We did
not issue any stock options in 2014 and 2013. The
assumptions used in the Black-Scholes option-pricing
model are as follows:
Dividend yield
Expected stock price volatility
Risk-free interest rate
Expected option life years
Expected volatility was based on a combination of
historical and implied volatilities. The risk-free interest
rate was based on United States Treasury zero coupon
issues with a remaining term equal to the expected
option life assumed at the date of grant. The expected
term was calculated based on historical experience
and represents the time period options actually remain
outstanding. We estimate forfeitures based on histori-
cal pre-vesting forfeiture rates and revise those esti-
mates as appropriate to reflect actual experience.
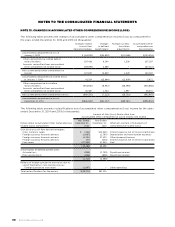
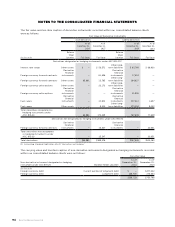
Stock option activity and information about stock options outstanding are summarized in the following table:
Stock Option Activity
Number
of Options
Weighted-
Average
Exercise
Price
Weighted-
Average
Remaining
Contractual
Term
Aggregate
Intrinsic
Value(1)
(years) (in thousands)
Outstanding at January 1, 2014
Granted — — — —
Exercised () — —
Canceled () — —
Outstanding at December 31, 2014
Vested and expected to vest at December 31, 2014
Options Exercisable at December 31, 2014
() The intrinsic value represents the amount by which the fair value of stock exceeds the option exercise price as of December 31, 2014.