Royal Caribbean Cruise Lines 2014 Annual Report Download - page 52
Download and view the complete annual report
Please find page 52 of the 2014 Royal Caribbean Cruise Lines annual report below. You can navigate through the pages in the report by either clicking on the pages listed below, or by using the keyword search tool below to find specific information within the annual report.
Royal Caribbean Cruises Ltd. 51
PART II
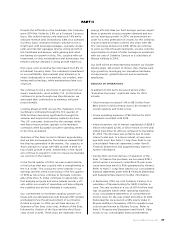
First Quarter 2015 AsReported
Constant
Currency
Net Yields Approx() ()to()
Net Cruise Costs per
APCD ()to() Approx()
Net Cruise Costs per
APCD, excluding Fuel Flattoup to
Capacity Increase
Depreciation and
Amortization
to
million
Interest Expense, net
to
million
Fuel Consumption
(metric tons)
Fuel Expenses million
Percent Hedged
(fwd consumption)
Impact of 10% change
in fuel prices million
Adjusted Earnings per
Share—Diluted to
Since our earnings release on January 29, 2015, book-
ings have remained encouraging and consistent with
our previous expectations. Accordingly, our forecast
has remained essentially unchanged.
YEAR ENDED DECEMBER 31, 2014 COMPARED TO
YEAR ENDED DECEMBER 31, 2013
In this section, references to 2014 refer to the year
ended December 31, 2014 and references to 2013
refer to the year ended December 31, 2013.
Revenues
Total revenues for 2014 increased $114.0 million, or
1.4%, to $8.1 billion from $8.0 billion in 2013.
Passenger ticket revenues comprised 73.0% of our
2014 total revenues. Passenger ticket revenues
increased by $171.1 million, or 3.0%, to $5.9 billion in
2014 from $5.7 billion in 2013. The increase was pri-
marily due to:
• a 2.4% increase in capacity, which increased Passen-
ger ticket revenues by $134.6 million. The increase in
capacity was primarily due to the addition of Quantum
of the Seas which entered service in October 2014
and the transfer of Monarch of the Seas to Pullmantur
in April 2013 reducing capacity in 2013 due to the
two-month lag further discussed in Note 1. General
to our consolidated financial statements. Passenger
ticket revenues also includes the impact of the change
in our voyage proration methodology; and
• an increase in ticket prices driven by greater demand
for close-in European and Asian sailings, which was
partially offset by a decrease in ticket prices for
Caribbean sailings, all of which contributed to a
$99.1 million increase in Passenger ticket revenues.
The increase in passenger ticket revenues was par-
tially offset by the unfavorable effect of changes in
foreign currency exchange rates related to our revenue
transactions denominated in currencies other than the
United States dollar of approximately $62.5 million.
The remaining 27.0% of 2014 total revenues was com-
prised of onboard and other revenues, which decreased
$57.2 million, or 2.6%. The decrease in onboard and
other revenues was primarily due to a $177.2 million
decrease in revenues related to Pullmantur’s non-core
businesses that were sold in 2014 as noted above. The
decrease was partially offset by:
• a $45.5 million increase in onboard revenue attribut-
able to higher spending on a per passenger basis
primarily due to our ship upgrade programs and
other revenue enhancing initiatives, including vari-
ous beverage initiatives, the addition and promotion
of specialty restaurants, the increased revenue asso-
ciated with internet and other telecommunication
services and other onboard activities;
• a $46.0 million increase attributable to the 2.4%
increase in capacity noted above, which includes the
impact of the change in our voyage proration; and
• a $28.7 million increase in other revenue of which
the largest driver is attributable to an out-of-period
adjustment of approximately $13.9 million that was
recorded in 2013 to correct the calculation of our
liability for our credit card rewards program.
Onboard and other revenues included concession
revenues of $324.3 million in 2014 and $316.3 million
in 2013.
Cruise Operating Expenses
Total cruise operating expenses for 2014 increased
$1.0 million. The increase was primarily due to:
• a $119.4 million increase attributable to the 2.4%
increase in capacity noted above, which includes
the impact of the change in our voyage proration
methodology;
• a $37.8 million increase in head taxes mainly attrib-
utable to itinerary changes;
• the loss recognized on the sale of Celebrity Century
of $17.4 million; and
• a $12.5 million increase primarily attributable to
vessel maintenance due to the timing of scheduled
drydocks.


