Royal Caribbean Cruise Lines 2014 Annual Report Download - page 40
Download and view the complete annual report
Please find page 40 of the 2014 Royal Caribbean Cruise Lines annual report below. You can navigate through the pages in the report by either clicking on the pages listed below, or by using the keyword search tool below to find specific information within the annual report.-
 1
1 -
2
-
3
-
4
-
5
-
6
-
7
-
8
-
9
-
10
-
11
-
12
-
13
-
14
-
15
-
16
-
17
-
18
-
19
-
20
-
21
-
22
-
23
-
24
-
25
-
26
-
27
-
28
-
29
-
 30
30 -
 31
31 -
 32
32 -
 33
33 -
 34
34 -
 35
35 -
 36
36 -
 37
37 -
 38
38 -
 39
39 -
 40
40 -
 41
41 -
 42
42 -
 43
43 -
 44
44 -
 45
45 -
 46
46 -
 47
47 -
 48
48 -
 49
49 -
 50
50 -
51
-
52
-
53
-
54
-
55
-
56
-
57
-
58
-
59
-
60
-
61
-
62
-
63
-
64
-
65
-
66
-
67
-
68
-
69
-
70
-
71
-
72
-
73
-
74
-
75
-
76
-
77
-
78
-
79
-
80
-
81
-
82
-
83
-
84
-
85
-
86
-
87
-
88
-
89
-
90
-
91
-
92
-
93
-
94
-
95
-
96
-
97
-
98
-
99
-
100
-
101
-
102
-
103
-
104
 |
 |

Royal Caribbean Cruises Ltd. 39
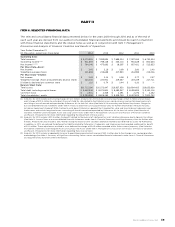
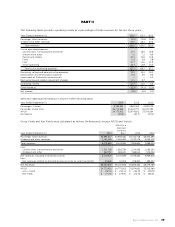
ITEM 6. SELECTED FINANCIAL DATA
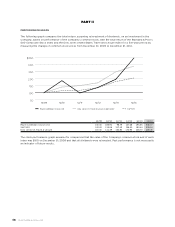
The selected consolidated financial data presented below for the years 2010 through 2014 and as of the end of
each such year are derived from our audited consolidated financial statements and should be read in conjunction
with those financial statements and the related notes as well as in conjunction with Item 7. Management’s
Discussion and Analysis of Financial Condition and Results of Operations.
Year Ended December 31,
(in thousands, except per share data)
Operating Data:
Total revenues
Operating income()()
Net income()()()
Per Share Data—Basic:
Net income
Weighted-average shares
Per Share Data—Diluted:
Net income
Weighted-average shares and potentially dilutive shares
Dividends declared per common share —
Balance Sheet Data:
Total assets
Total debt, including capital leases
Common stock
Total shareholders’ equity
() Amounts for 2014 include restructuring charges of $4.3 million. Amounts for 2013 include restructuring charges of $23.4 million and an impair-
ment charge of $33.5 million to write down the assets held for sale related to the Pullmantur non-core businesses and certain long-lived assets,
consisting of aircraft owned and operated by Pullmantur Air, to their fair value (See Note 16. Restructuring and Related Impairment Charges to
our consolidated financial statements under Item 8. Financial Statements and Supplementary Data for further information). Amounts for 2012
include an impairment charge of $385.4 million to write down Pullmantur’s goodwill to its implied fair value and to write down trademarks and
trade names and certain long-lived assets, consisting of aircraft owned and operated by Pullmantur Air, to their fair value. (See Valuation of
Goodwill, Indefinite-Lived Intangible Assets and Long-Lived Assets under Item 7. Management’s Discussion and Analysis of Financial Condition
and Results of Operations for more information regarding the impairment of these assets).
() Amounts for 2014 include a $33.5 million tax benefit related to the reversal of a deferred tax asset valuation allowance due to Spanish tax reform.
(See Note 12. Income Taxes to our consolidated financial statements under Item 8. Financial Statements and Supplementary Data for further infor-
mation). Amounts for 2012 include a $33.7 million charge to record a 100% valuation allowance related to our deferred tax assets for Pullmantur.
In addition, in 2012, we reduced the deferred tax liability related to Pullmantur’s trademarks and trade names and recorded a deferred tax benefit
of $5.2 million. These adjustments resulted in a net deferred tax charge of $28.5 million recorded within Other income (expense). (See Valuation
of Goodwill, Indefinite-Lived Intangible Assets and Long-Lived Assets under Item 7. Management’s Discussion and Analysis of Financial Condition
and Results of Operations for more information regarding these transactions).
() Amounts for 2014 include an aggregate increase to operating income and net income of $53.2 million due to the change in our voyage proration
methodology (See Note 2. Summary of Significant Accounting Policies to our consolidated financial statements under Item 8. Financial Statements
and Supplementary Data for further information).
PART II