Royal Caribbean Cruise Lines 2011 Annual Report Download - page 92
Download and view the complete annual report
Please find page 92 of the 2011 Royal Caribbean Cruise Lines annual report below. You can navigate through the pages in the report by either clicking on the pages listed below, or by using the keyword search tool below to find specific information within the annual report.-
 1
1 -
2
-
3
-
4
-
5
-
6
-
7
-
8
-
9
-
10
-
11
-
12
-
13
-
14
-
15
-
16
-
17
-
18
-
19
-
20
-
21
-
22
-
23
-
24
-
25
-
26
-
27
-
28
-
29
-
30
-
31
-
32
-
33
-
34
-
35
-
36
-
37
-
38
-
39
-
40
-
41
-
42
-
43
-
44
-
45
-
46
-
47
-
48
-
49
-
50
-
51
-
52
-
53
-
54
-
55
-
56
-
57
-
58
-
59
-
60
-
61
-
62
-
63
-
64
-
65
-
66
-
67
-
68
-
69
-
70
-
71
-
72
-
73
-
74
-
75
-
76
-
77
-
78
-
79
-
80
-
81
-
 82
82 -
 83
83 -
 84
84 -
 85
85 -
 86
86 -
 87
87 -
 88
88 -
 89
89 -
 90
90 -
 91
91 -
 92
92 -
 93
93 -
 94
94 -
 95
95 -
 96
96 -
 97
97 -
 98
98 -
 99
99 -
 100
100 -
 101
101
 |
 |

2011 ANNUAL REPORT 88
NOTES TO THE CONSOLIDATED FINANCIAL STATEMENTS
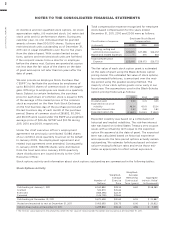
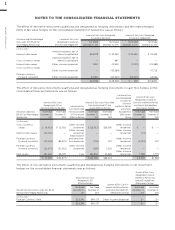
and investments’ functional currencies. As of
December 31, 2011 and 2010, we have assigned debt
of approximately €665.0 million and €469.3 million,
or approximately $863.2 million and $628.2 million,
respectively, as a hedge of our net investment in
Pullmantur and TUI Cruises.
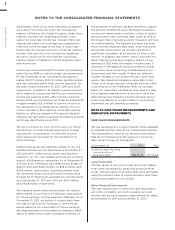
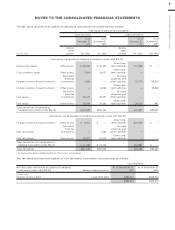
Fuel Price Risk
Our exposure to market risk for changes in fuel prices
relates primarily to the consumption of fuel on our
ships. We use fuel swap agreements and fuel call
options to mitigate the financial impact of fluctuations
in fuel prices.
Our fuel swap agreements are accounted for as cash
flow hedges. At December 31, 2011, we have hedged
the variability in future cash flows for certain fore-
casted fuel transactions occurring through 2015. As of
December 31, 2011 and 2010, we have entered into the
following fuel swap agreements:
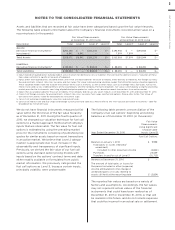
Fuel Swap Agreements
As of As of
December 31, December 31,
(metric tons)
—
—
—
Fuel Swap Agreements
As of As of
Projected fuel purchases December 31, December 31,
for year:
(% hedged)
—
—
At December 31, 2011 and 2010, $78.5 million and
$83.6 million, respectively, of estimated unrealized
net gains associated with our cash flow hedges per-
taining to fuel swap agreements were expected to
be reclassified to earnings from other accumulated
comprehensive (loss) income within the next twelve
months. Reclassification is expected to occur as the
result of fuel consumption associated with our
hedged forecasted fuel purchases.
Additionally, as of December 31, 2011 and 2010, we
have entered into fuel call options on a total of 1.0
million barrels of fuel oil which mature in 2013, and
6.6 million barrels, maturing between 2011 and 2013,
respectively, in order to provide protection in the
event fuel prices exceed the options’ exercise prices.
Our fuel call options are not designated as hedging
instruments. As a result, changes in the fair value of
our fuel call options are recognized in earnings imme-
diately and are reported in other income (expense)
in our consolidated statements of operations. During
2011, we terminated 100% of our fuel call options
maturing in 2011 and 2012 in order to monetize previ-
ously recorded gains pertaining to the fuel call options’
fair value prior to their expiration. Upon termination
of these options, we recognized a gain of approxi-
mately $7.3 million and received net cash proceeds of
approximately $34.3 million which were reflected as
cash flows from investing activities. We accounted for
the settlement of these fuel call options by recording
the cash received and removing the fair value of the
instrument from our balance sheet. As of December 31,
2011, the fuel call options represented 9% of our pro-
jected 2013 fuel requirements. As of December 31,
2010, the fuel call options represented 41% of our pro-
jected 2011 fuel requirements, 25% of our projected
2012 fuel requirements and 11% of our projected 2013
fuel requirements.