Royal Caribbean Cruise Lines 2011 Annual Report Download - page 41
Download and view the complete annual report
Please find page 41 of the 2011 Royal Caribbean Cruise Lines annual report below. You can navigate through the pages in the report by either clicking on the pages listed below, or by using the keyword search tool below to find specific information within the annual report.-
 1
1 -
2
-
3
-
4
-
5
-
6
-
7
-
8
-
9
-
10
-
11
-
12
-
13
-
14
-
15
-
16
-
17
-
18
-
19
-
20
-
21
-
22
-
23
-
24
-
25
-
26
-
27
-
28
-
29
-
30
-
 31
31 -
 32
32 -
 33
33 -
 34
34 -
 35
35 -
 36
36 -
 37
37 -
 38
38 -
 39
39 -
 40
40 -
 41
41 -
 42
42 -
 43
43 -
 44
44 -
 45
45 -
 46
46 -
 47
47 -
 48
48 -
 49
49 -
 50
50 -
 51
51 -
52
-
53
-
54
-
55
-
56
-
57
-
58
-
59
-
60
-
61
-
62
-
63
-
64
-
65
-
66
-
67
-
68
-
69
-
70
-
71
-
72
-
73
-
74
-
75
-
76
-
77
-
78
-
79
-
80
-
81
-
82
-
83
-
84
-
85
-
86
-
87
-
88
-
89
-
90
-
91
-
92
-
93
-
94
-
95
-
96
-
97
-
98
-
99
-
100
-
101
 |
 |
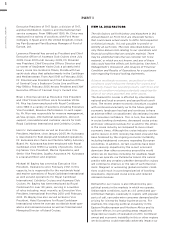
PART II
ROYAL CARIBBEAN CRUISES LTD. 37
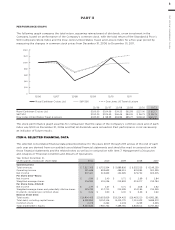
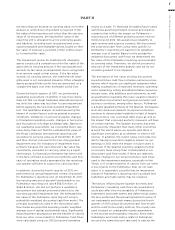
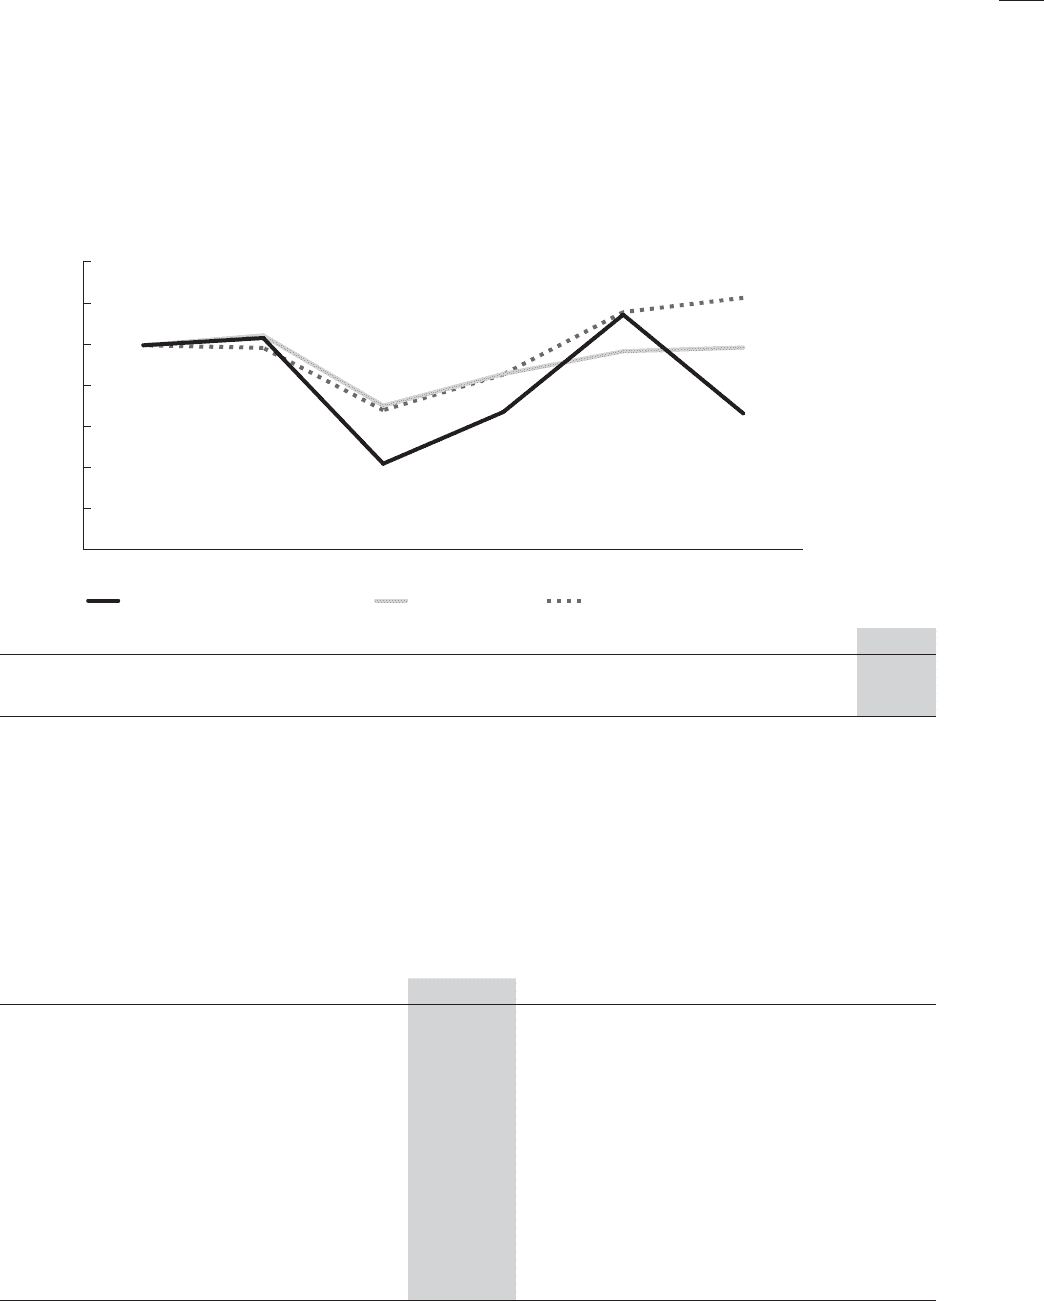
PERFORMANCE GRAPH
The following graph compares the total return, assuming reinvestment of dividends, on an investment in the
Company, based on performance of the Company’s common stock, with the total return of the Standard & Poor’s
500 Composite Stock Index and the Dow Jones United States Travel and Leisure Index for a five-year period by
measuring the changes in common stock prices from December 31, 2006 to December 31, 2011.
Royal Caribbean Cruises Ltd.
S&P 500
Dow Jones United States Travel & Leisure
The stock performance graph assumes for comparison that the value of the Company’s common stock and of each
index was $100 on December 31, 2006 and that all dividends were reinvested. Past performance is not necessarily
an indicator of future results.
ITEM 6. SELECTED FINANCIAL DATA
The selected consolidated financial data presented below for the years 2007 through 2011 and as of the end of each
such year are derived from our audited consolidated financial statements and should be read in conjunction with
those financial statements and the related notes as well as in conjunction with Item 7. Management’s Discussion
and Analysis of Financial Condition and Results of Operations.
Year Ended December 31,
(in thousands, except per share data)
Operating Data:
Total revenues
Operating income
Net income
Per Share Data—Basic:
Net income
Weighted-average shares
Per Share Data—Diluted:
Net income
Weighted-average shares and potentially dilutive shares
Dividends declared per common share
Balance Sheet Data:
Total assets
Total debt, including capital leases
Common stock
Total shareholders’ equity
0
$20
$40
$60
$80
$100
$120
$140
12/06
Royal Caribbean Cruises Ltd. S&P 500 Dow Jones US Travel & Leisure
12/07 12/08 12/09 12/10 12/11