Royal Caribbean Cruise Lines 2011 Annual Report Download - page 86
Download and view the complete annual report
Please find page 86 of the 2011 Royal Caribbean Cruise Lines annual report below. You can navigate through the pages in the report by either clicking on the pages listed below, or by using the keyword search tool below to find specific information within the annual report.-
 1
1 -
2
-
3
-
4
-
5
-
6
-
7
-
8
-
9
-
10
-
11
-
12
-
13
-
14
-
15
-
16
-
17
-
18
-
19
-
20
-
21
-
22
-
23
-
24
-
25
-
26
-
27
-
28
-
29
-
30
-
31
-
32
-
33
-
34
-
35
-
36
-
37
-
38
-
39
-
40
-
41
-
42
-
43
-
44
-
45
-
46
-
47
-
48
-
49
-
50
-
51
-
52
-
53
-
54
-
55
-
56
-
57
-
58
-
59
-
60
-
61
-
62
-
63
-
64
-
65
-
66
-
67
-
68
-
69
-
70
-
71
-
72
-
73
-
74
-
75
-
 76
76 -
 77
77 -
 78
78 -
 79
79 -
 80
80 -
 81
81 -
 82
82 -
 83
83 -
 84
84 -
 85
85 -
 86
86 -
 87
87 -
 88
88 -
 89
89 -
 90
90 -
 91
91 -
 92
92 -
 93
93 -
 94
94 -
 95
95 -
 96
96 -
97
-
98
-
99
-
100
-
101
 |
 |

2011 ANNUAL REPORT 82
NOTES TO THE CONSOLIDATED FINANCIAL STATEMENTS
(i) incentive and non-qualified stock options, (ii) stock
appreciation rights, (iii) restricted stock, (iv) restricted
stock units and (v) performance shares. During any
calendar year, no one individual shall be granted
awards of more than 500,000 shares. Options and
restricted stock units outstanding as of December 31,
2011 vest in equal installments over four to five years
from the date of grant. With certain limited excep-
tions, options and restricted stock units are forfeited
if the recipient ceases to be a director or employee
before the shares vest. Options are granted at a price
not less than the fair value of the shares on the date
of grant and expire not later than ten years after the
date of grant.
We also provide an Employee Stock Purchase Plan
(“ESPP”) to facilitate the purchase by employees of
up to 800,000 shares of common stock in the aggre-
gate. Offerings to employees are made on a quarterly
basis. Subject to certain limitations, the purchase
price for each share of common stock is equal to 90%
of the average of the market prices of the common
stock as reported on the New York Stock Exchange
on the first business day of the purchase period and
the last business day of each month of the purchase
period. Shares of common stock of 28,802, 30,054,
and 65,005 were issued under the ESPP at a weighted-
average price of $29.46, $27.87 and $12.78 during
2011, 2010 and 2009, respectively.
Under the chief executive officer’s employment
agree ment we previously contributed 10,086 shares
of our common stock quarterly to a trust on his behalf.
In January 2009, the employment agreement and
related trust agreement were amended. Consequently,
in January 2009, 768,018 shares were distributed
from the trust and since January 2009 quarterly
share distributions are issued directly to the Chief
Executive Officer.
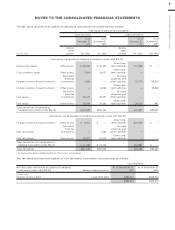
Total compensation expense recognized for employee
stock-based compensation for the years ended
December 31, 2011, 2010 and 2009 were as follows:
Classification of expense
Employee Stock-Based
Compensation
(in thousands)
Marketing, selling and
administrative expenses
Payroll and related expenses —
Total Compensation
Expense
The fair value of each stock option grant is estimated
on the date of grant using the Black-Scholes option
pricing model. The estimated fair value of stock options,
less estimated forfeitures, is amortized over the vest-
ing period using the graded-vesting method. The
majority of our stock option grants occur early in our
fiscal year. The assumptions used in the Black-Scholes
option-pricing model are as follows:
Dividend yield
Expected stock price
volatility
Risk-free interest rate
Expected option life 6 years 6 years 5 years
Expected volatility was based on a combination of
historical and implied volatilities. The risk-free interest
rate was based on United States Treasury zero coupon
issues with a remaining term equal to the expected
option life assumed at the date of grant. The expected
term was calculated based on historical experience
and represents the time period options actually remain
outstanding. We estimate forfeitures based on histori-
cal pre-vesting forfeiture rates and revise those esti-
mates as appropriate to reflect actual experience.
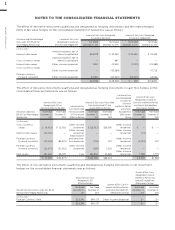
Stock options activity and information about stock options outstanding are summarized in the following tables:
Stock Options Activity
Weighted-
Weighted- Average
Average Remaining Aggregate
Number of Exercise Contractual Intrinsic Value1
Options Price Term (years) (in thousands)
Outstanding at January 1, 2011
Granted
Exercised ()
Canceled ()
Outstanding at December 31, 2011
Vested and expected to vest at December 31, 2011
Options Exercisable at December 31, 2011
1 The intrinsic value represents the amount by which the fair value of stock exceeds the option exercise price as of December 31, 2011.