Royal Caribbean Cruise Lines 2011 Annual Report Download - page 87
Download and view the complete annual report
Please find page 87 of the 2011 Royal Caribbean Cruise Lines annual report below. You can navigate through the pages in the report by either clicking on the pages listed below, or by using the keyword search tool below to find specific information within the annual report.-
 1
1 -
2
-
3
-
4
-
5
-
6
-
7
-
8
-
9
-
10
-
11
-
12
-
13
-
14
-
15
-
16
-
17
-
18
-
19
-
20
-
21
-
22
-
23
-
24
-
25
-
26
-
27
-
28
-
29
-
30
-
31
-
32
-
33
-
34
-
35
-
36
-
37
-
38
-
39
-
40
-
41
-
42
-
43
-
44
-
45
-
46
-
47
-
48
-
49
-
50
-
51
-
52
-
53
-
54
-
55
-
56
-
57
-
58
-
59
-
60
-
61
-
62
-
63
-
64
-
65
-
66
-
67
-
68
-
69
-
70
-
71
-
72
-
73
-
74
-
75
-
76
-
 77
77 -
 78
78 -
 79
79 -
 80
80 -
 81
81 -
 82
82 -
 83
83 -
 84
84 -
 85
85 -
 86
86 -
 87
87 -
 88
88 -
 89
89 -
 90
90 -
 91
91 -
 92
92 -
 93
93 -
 94
94 -
 95
95 -
 96
96 -
 97
97 -
98
-
99
-
100
-
101
 |
 |

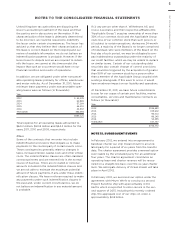
NOTES TO THE CONSOLIDATED FINANCIAL STATEMENTS
ROYAL CARIBBEAN CRUISES LTD. 83
The weighted-average estimated fair value of stock
options granted was $21.39, $11.69 and $3.68 during
the years ended December 31, 2011, 2010 and 2009,
respectively. The total intrinsic value of stock options
exercised during the years ended December 31, 2011,
2010 and 2009 was $17.3 million, $26.9 million and
$0.5 million, respectively. As of December 31, 2011,
there was approximately $6.9 million of total unrecog-
nized compensation cost, net of estimated forfeitures,
related to stock options granted under our stock
incentive plans which is expected to be recognized
over a weighted-average period of 0.9 years.
Restricted stock units are converted into shares of
common stock upon vesting on a one-for-one basis.
The cost of these awards is determined using the fair
value of our common stock on the date of the grant,
and compensation expense is recognized over the
vesting period. Restricted stock activity is summa-
rized in the following table:
Restricted Stock Activity
Weighted-
Average
Number Grant Date
of Awards Fair Value
Non-vested share units at
January 1, 2011
Granted
Vested ()
Canceled ()
Non-vested share units
expected to vest as of
December 31, 2011
The weighted-average estimated fair value of
restricted stock units granted during the year ended
December 31, 2010 and 2009 were $25.32 and $7.68,
respectively. The total fair value of shares released on
the vesting of restricted stock units during the years
ended December 31, 2011, 2010 and 2009 was $25.1
million, $12.0 million and $2.5 million, respectively.
As of December 31, 2011, we had $8.5 million of total
unrecognized compensation expense, net of estimated
forfeitures, related to restricted stock unit grants,
which will be recognized over the weighted-average
period of 1.0 years.
NOTE 10. EARNINGS PER SHARE
A reconciliation between basic and diluted earnings
per share is as follows (in thousands, except per
share data):
Year Ended December 31,
Net income for basic
and diluted earnings
pe r sh are
Weighted-average
common shares
outstanding
Dilutive effect of stock
options and restricted
stock awards
Diluted weighted-
average shares
outstanding
Basic earnings per share:
Net income
Diluted earnings
per share:
Net income
Diluted earnings per share did not include options to
purchase 2.8 million, 2.6 million and 5.0 million shares
for each of the years ended December 31, 2011, 2010
and 2009, respectively, because the effect of including
them would have been antidilutive.
NOTE 11. RETIREMENT PLAN
We maintain a defined contribution pension plan
covering full-time shoreside employees who have
completed the minimum period of continuous service.
Annual contributions to the plan are based on fixed
percentages of participants’ salaries and years of
service, not to exceed certain maximums. Pension
expenses were $15.3 million, $13.3 million and $13.6
million for the years ended December 31, 2011, 2010
and 2009, respectively.
NOTE 12. INCOME TAXES
We and the majority of our subsidiaries are currently
exempt from United States corporate tax on United
States source income from the international operation
of ships pursuant to Section 883 of the Internal Revenue
Code. Regulations under Section 883 have limited the
activities that are considered the international opera-
tion of a ship or incidental thereto. Accordingly, our
provision for United States federal and state income
taxes includes taxes on certain activities not considered
incidental to the international operation of our ships.