Royal Caribbean Cruise Lines 2011 Annual Report Download - page 48
Download and view the complete annual report
Please find page 48 of the 2011 Royal Caribbean Cruise Lines annual report below. You can navigate through the pages in the report by either clicking on the pages listed below, or by using the keyword search tool below to find specific information within the annual report.-
 1
1 -
2
-
3
-
4
-
5
-
6
-
7
-
8
-
9
-
10
-
11
-
12
-
13
-
14
-
15
-
16
-
17
-
18
-
19
-
20
-
21
-
22
-
23
-
24
-
25
-
26
-
27
-
28
-
29
-
30
-
31
-
32
-
33
-
34
-
35
-
36
-
37
-
 38
38 -
 39
39 -
 40
40 -
 41
41 -
 42
42 -
 43
43 -
 44
44 -
 45
45 -
 46
46 -
 47
47 -
 48
48 -
 49
49 -
 50
50 -
 51
51 -
 52
52 -
 53
53 -
 54
54 -
 55
55 -
 56
56 -
 57
57 -
 58
58 -
59
-
60
-
61
-
62
-
63
-
64
-
65
-
66
-
67
-
68
-
69
-
70
-
71
-
72
-
73
-
74
-
75
-
76
-
77
-
78
-
79
-
80
-
81
-
82
-
83
-
84
-
85
-
86
-
87
-
88
-
89
-
90
-
91
-
92
-
93
-
94
-
95
-
96
-
97
-
98
-
99
-
100
-
101
 |
 |

2011 ANNUAL REPORT 44
PART II
we do not believe that reconciling information for such
projected figures would be meaningful.
Net Debt-to-Capital is a ratio which represents total
long-term debt, including current portion of long-term
debt, less cash and cash equivalents (“Net Debt”)
divided by the sum of Net Debt and total shareholders’
equity. We believe Net Debt and Net Debt-to-Capital,
along with total long-term debt and shareholders’
equity are useful measures of our capital structure.
A reconciliation of historical Debt-to-Capital to Net
Debt-to-Capital is provided below under Results
of Operations.
Net Revenues represent total revenues less commis-
sions, transportation and other expenses and onboard
and other expenses (each of which is described under
the Description of Certain Line Items heading).
Net Yields represent Net Revenues per APCD. We uti-
lize Net Revenues and Net Yields to manage our busi-
ness on a day-to-day basis as we believe that it is the
most relevant measure of our pricing performance
because it reflects the cruise revenues earned by us
net of our most significant variable costs, which are
commissions, transportation and other expenses and
onboard and other expenses. A reconciliation of his-
torical Gross Yields to Net Yields is provided below
under Results of Operations. We have not provided a
quantitative reconciliation of projected Gross Yields
to projected Net Yields due to the significant uncer-
tainty in projecting the costs deducted to arrive at
this measure. Accordingly, we do not believe that rec-
onciling information for such projected figures would
be meaningful.
Occupancy, in accordance with cruise vacation indus-
try practice, is calculated by dividing Passenger
Cruise Days by APCD. A percentage in excess of 100%
indicates that three or more passengers occupied
some cabins.
Passenger Cruise Days represent the number of
passengers carried for the period multiplied by the
number of days of their respective cruises.
We believe Net Yields, Net Cruise Costs and Net Cruise
Costs Excluding Fuel are our most relevant non-GAAP
financial measures. However, a significant portion of
our revenue and expenses are denominated in curren-
cies other than the United States dollar. Because our
reporting currency is the United States dollar, the
value of these revenues and expenses can be affected
by changes in currency exchange rates. Although
such changes in local currency prices is just one of
many elements impacting our revenues and expenses,
it can be an important element. For this reason, we
also monitor Net Yields, Net Cruise Costs and Net
Cruise Costs Excluding Fuel as if the current periods’
currency exchange rates had remained constant with
the comparable prior periods’ rates, or on a “Constant
Currency” basis.
It should be emphasized that Constant Currency is
primarily used for comparing short-term changes
and/or projections. Over the longer term, changes in
guest sourcing and shifting the amount of purchases
between currencies can significantly change the
impact of the purely currency-based fluctuations.
The use of certain significant non-GAAP measures,
such as Net Yields, Net Cruise Costs and Net Cruise
Costs Excluding Fuel, allow us to perform capacity
and rate analysis to separate the impact of known
capacity changes from other less predictable changes
which affect our business. We believe these non-GAAP
measures provide expanded insight to measure reve-
nue and cost performance in addition to the standard
United States GAAP based financial measures. There
are no specific rules or regulations for determining
non-GAAP and Constant Currency measures, and as
such, there exists the possibility that they may not be
comparable to other companies within the industry.
EXECUTIVE OVERVIEW
During 2011, our business demonstrated its fundamen-
tal strength and the efficacy of our business model.
Despite the impact of geopolitical events including
the political unrest in the Eastern Mediterranean and
Northern Africa and the earthquake and related events
in Japan as well as the uncertain global economic
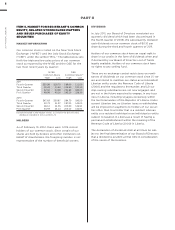
environment, our net income for 2011 increased approx-
imately 18% to $607.4 million in 2011 from $515.7 million
in 2010 and our Net Yields increased 4.1%.
Prior to the recent tragedy in Italy involving the Costa
Concordia, booking patterns for 2012 were strong and
WAVE season (traditionally the first two months of
the year where cruise lines experience disproportion-
ately higher volume cruise sales) was off to an excel-
lent start. However, the Costa Concordia incident is
having a near-term effect on our bookings and the
impact on our earnings in 2012 and beyond remains
uncertain. Refer to our Outlook section for a further
discussion on our expected future results.
The globalization of our operations continues to be a
major initiative for 2012 and beyond, especially within
developmental markets. During 2012, we expect a sig-
nificant amount of our passenger ticket revenues from
outside of the United States. In 2012, Royal Caribbean
International will focus on the development of key
markets in Southern Europe and Asia, where we have
established a leading position in the Chinese market.
In furtherance of this, during 2012, Royal Caribbean
International will seasonally add a second ship in Asia
and a third ship in Australia, add new departure ports