Royal Caribbean Cruise Lines 2011 Annual Report Download - page 76
Download and view the complete annual report
Please find page 76 of the 2011 Royal Caribbean Cruise Lines annual report below. You can navigate through the pages in the report by either clicking on the pages listed below, or by using the keyword search tool below to find specific information within the annual report.-
 1
1 -
2
-
3
-
4
-
5
-
6
-
7
-
8
-
9
-
10
-
11
-
12
-
13
-
14
-
15
-
16
-
17
-
18
-
19
-
20
-
21
-
22
-
23
-
24
-
25
-
26
-
27
-
28
-
29
-
30
-
31
-
32
-
33
-
34
-
35
-
36
-
37
-
38
-
39
-
40
-
41
-
42
-
43
-
44
-
45
-
46
-
47
-
48
-
49
-
50
-
51
-
52
-
53
-
54
-
55
-
56
-
57
-
58
-
59
-
60
-
61
-
62
-
63
-
64
-
65
-
 66
66 -
 67
67 -
 68
68 -
 69
69 -
 70
70 -
 71
71 -
 72
72 -
 73
73 -
 74
74 -
 75
75 -
 76
76 -
 77
77 -
 78
78 -
 79
79 -
 80
80 -
 81
81 -
 82
82 -
 83
83 -
 84
84 -
 85
85 -
 86
86 -
87
-
88
-
89
-
90
-
91
-
92
-
93
-
94
-
95
-
96
-
97
-
98
-
99
-
100
-
101
 |
 |

2011 ANNUAL REPORT 72
NOTES TO THE CONSOLIDATED FINANCIAL STATEMENTS
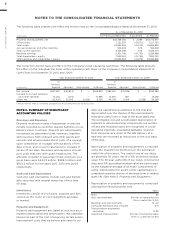
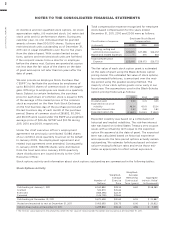
The following table presents the effect the revision had on the Consolidated Balance Sheet at December 31, 2010:
As of December 31, 2010
(in thousands) As Previously Reported Adjustment As Revised
Property and equipment, net
Other assets ()
Total assets ()
Accrued expenses and other liabilities
Total current liabilities
Retained earnings ()
Total shareholders’ equity ()
Total liabilities and shareholders’ equity ()
The correction did not have an effect on the Company’s total operating cash flows. The following table presents
the effect on the individual line items within operating cash flows on the Company’s Consolidated Statement of
Cash Flows for December 31, 2010 and 2009:
Year Ended December 31, 2010 Year Ended December 31, 2009
(in thousands)
As
Previously
Reported Adjustment Reclassification
1
As Revised
As
Previously
Reported Adjustment Reclassification
1
As Revised
Net Income () — () —
Increase in accrued expenses
and other liabilities () — —
Other, net () () ()
1 Please refer to Note 2. Summary of Significant Accounting Policies for discussion.
NOTE 2. SUMMARY OF SIGNIFICANT
ACCOUNTING POLICIES
Revenues and Expenses
Deposits received on sales of passenger cruises are
initially recorded as customer deposit liabilities on our
balance sheet. Customer deposits are subsequently
recognized as passenger ticket revenues, together
with revenues from onboard and other goods and
services and all associated direct costs of a voyage,
upon completion of voyages with durations of ten
days or less, and on a pro rata basis for voyages in
excess of ten days. Revenues and expenses include
port costs that vary with guest headcounts. The
amounts included in passenger ticket revenues on a
gross basis were $442.9 million, $398.0 million and
$303.2 million for the years 2011, 2010 and 2009,
respectively.
Cash and Cash Equivalents
Cash and cash equivalents include cash and market-
able securities with original maturities of less than
90 days.
Inventories
Inventories consist of provisions, supplies and fuel
carried at the lower of cost (weighted-average)
or market.
Property and Equipment
Property and equipment are stated at cost less accu-
mulated depreciation and amortization. We capitalize
interest as part of the cost of acquiring certain assets.
Improvement costs that we believe add value to our
ships are capitalized as additions to the ship and
depreciated over the shorter of the improvements’
estimated useful lives or that of the associated ship.
The estimated cost and accumulated depreciation of
replaced or refurbished ship components are written-
off and any resulting losses are recognized in cruise
operating expenses. Liquidated damages received
from shipyards as a result of the late delivery of a
new ship are recorded as reductions to the cost basis
of the ship.
Depreciation of property and equipment is computed
using the straight-line method over the estimated
useful life of the asset. The useful lives of our ships
are generally 30 years, net of a 15% projected residual
value. The 30-year useful life of our newly constructed
ships and 15% associated residual value are both based
on the weighted-average of all major components of
a ship. Depreciation for assets under capital leases is
computed using the shorter of the lease term or related
asset life. (See Note 5. Property and Equipment.)
Depreciation of property and equipment is computed
utilizing the following useful lives:
Years
Ships 30
Ship improvements Shorter of remaining ship
life or useful life (3–20)
Buildings and improvements 10–40
Computer hardware and software 3–5
Transportation equipment
and other 3–30
Leasehold improvements Shorter of remaining lease
term or useful life (3–30)