Royal Caribbean Cruise Lines 2011 Annual Report Download - page 16
Download and view the complete annual report
Please find page 16 of the 2011 Royal Caribbean Cruise Lines annual report below. You can navigate through the pages in the report by either clicking on the pages listed below, or by using the keyword search tool below to find specific information within the annual report.-
 1
1 -
2
-
3
-
4
-
5
-
 6
6 -
 7
7 -
 8
8 -
 9
9 -
 10
10 -
 11
11 -
 12
12 -
 13
13 -
 14
14 -
 15
15 -
 16
16 -
 17
17 -
 18
18 -
 19
19 -
 20
20 -
 21
21 -
 22
22 -
 23
23 -
 24
24 -
 25
25 -
 26
26 -
27
-
28
-
29
-
30
-
31
-
32
-
33
-
34
-
35
-
36
-
37
-
38
-
39
-
40
-
41
-
42
-
43
-
44
-
45
-
46
-
47
-
48
-
49
-
50
-
51
-
52
-
53
-
54
-
55
-
56
-
57
-
58
-
59
-
60
-
61
-
62
-
63
-
64
-
65
-
66
-
67
-
68
-
69
-
70
-
71
-
72
-
73
-
74
-
75
-
76
-
77
-
78
-
79
-
80
-
81
-
82
-
83
-
84
-
85
-
86
-
87
-
88
-
89
-
90
-
91
-
92
-
93
-
94
-
95
-
96
-
97
-
98
-
99
-
100
-
101
 |
 |

2011 ANNUAL REPORT 12
PART I
berths at the end of 2011. There are approximately
10 ships with an estimated 34,000 berths that are
expected to be placed in service in the North American
cruise market between 2012 and 2016.
Europe
In Europe, cruising represents a smaller but growing
sector of the vacation industry. It has experienced a
compound annual growth rate in cruise guests of
approximately 9.6% from 2007 to 2011 and we believe
this market has significant continued growth poten-
tial. We estimate that Europe was served by 104 ships
with approximately 100,000 berths at the beginning
of 2007 and by 121 ships with approximately 155,000
berths at the end of 2011. There are approximately
10 ships with an estimated 28,000 berths that are
expected to be placed in service in the European
cruise market between 2012 and 2016.
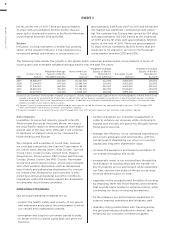
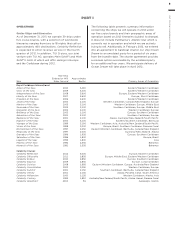
The following table details the growth in the global, North American and European cruise markets in terms of
cruise guests and estimated weighted-average berths over the past five years:
Year
Global Cruise
Guests(1)
Weighted-Average
Supply of Berths
Marketed Globally(1)
North American
Cruise
Guests(2)
Weighted-Average
Supply of Berths
Marketed in
North America(1)
European Cruise
Guests(3)
Weighted-Average
Supply of Berths
Marketed in
Europe(1)
(1) Source: Our estimates of the number of global cruise guests, and the weighted-average supply of berths marketed globally, in North America and
Europe are based on a combination of data that we obtain from various publicly available cruise industry trade information sources including
Seatrade Insider and Cruise Line International Association. In addition, our estimates incorporate our own statistical analysis utilizing the same
publicly available cruise industry data as a base.
(2) Source: Cruise Line International Association based on cruise guests carried for at least two consecutive nights for years 2007 through 2010.
Year 2011 amounts represent our estimates (see number 1 above).
(3) Source: European Cruise Council for years 2007 through 2010. Year 2011 amounts represent our estimates (see number 1 above).
Other Markets
In addition to expected industry growth in North
America and Europe as discussed above, we expect
the Asia/Pacific region to demonstrate an even higher
growth rate in the near term, although it will continue
to represent a relatively small sector compared to
North America and Europe.
We compete with a number of cruise lines; however,
our principal competitors are Carnival Corporation &
plc, which owns, among others, Aida Cruises, Carnival
Cruise Lines, Costa Cruises, Cunard Line, Holland
America Line, Iberocruceros, P&O Cruises and Princess
Cruises; Disney Cruise Line; MSC Cruises; Norwegian
Cruise Line and Oceania Cruises. Cruise lines compete
with other vacation alternatives such as land-based
resort hotels and sightseeing destinations for consum-
ers’ leisure time. Demand for such activities is influ-
enced by political and general economic conditions.
Companies within the vacation market are dependent
on consumer discretionary spending.
OPERATING STRATEGIES
Our principal operating strategies are to:
đƫƫ,.+0!0ƫ0$!ƫ$!(0$Čƫ/"!05ƫ* ƫ/!1.%05ƫ+"ƫ+1.ƫ#1!/0/ƫ
and employees and protect the environment in which
our vessels and organization operate,
đƫƫ/0.!*#0$!*ƫ* ƫ/1,,+.0ƫ+1.ƫ$1)*ƫ,%0(ƫ%*ƫ+. !.ƫ
to better serve our global guest base and grow our
business,
đƫƫ"1.0$!.ƫ/0.!*#0$!*ƫ+1.ƫ+*/1)!.ƫ!*##!)!*0ƫ%*ƫ
order to enhance our revenues while continuing to
expand and diversify our guest mix through interna-
tional guest sourcing,
đƫƫ)*#!ƫ0$!ƫ!""%%!*5ƫ+"ƫ+1.ƫ+,!.0%*#ƫ!4,!* %01.!/ƫ
and ensure adequate cash and liquidity, with the
overall goal of maximizing our return on invested
capital and long-term shareholder value,
đƫƫ%*.!/!ƫ0$!ƫ3.!*!//ƫ* ƫ).'!0ƫ,!*!0.0%+*ƫ+"ƫ
our brands throughout the world,
đƫƫ/0.0!#%((5ƫ%*2!/0ƫ%*ƫ+1.ƫ!4%/0%*#ƫ"(!!0ƫ0$.+1#$ƫ0$!ƫ
revitalization of existing ships and the transfer of
key innovations across each brand, while expanding
our fleet with the new state-of-the-art cruise ships
recently delivered and on order,
đƫƫ,%0(%6!ƫ+*ƫ0$!ƫ,+.0%(%05ƫ* ƫ"(!4%%(%05ƫ+"ƫ+1.ƫ/$%,/ƫ
by deploying them into those markets and itineraries
that provide opportunities to optimize returns, while
continuing our focus on existing key markets,
đƫƫ"1.0$!.ƫ!*$*!ƫ+1.ƫ0!$*+(+#%(ƫ,%(%0%!/ƫ0+ƫ
support ongoing operations and initiatives, and
đƫƫ)%*0%*ƫ/0.+*#ƫ.!(0%+*/$%,/ƫ3%0$ƫ0.2!(ƫ#!*%!/Čƫ
the principal industry distribution channel, while
enhancing our consumer outreach programs.