Royal Caribbean Cruise Lines 2011 Annual Report Download - page 52
Download and view the complete annual report
Please find page 52 of the 2011 Royal Caribbean Cruise Lines annual report below. You can navigate through the pages in the report by either clicking on the pages listed below, or by using the keyword search tool below to find specific information within the annual report.-
 1
1 -
2
-
3
-
4
-
5
-
6
-
7
-
8
-
9
-
10
-
11
-
12
-
13
-
14
-
15
-
16
-
17
-
18
-
19
-
20
-
21
-
22
-
23
-
24
-
25
-
26
-
27
-
28
-
29
-
30
-
31
-
32
-
33
-
34
-
35
-
36
-
37
-
38
-
39
-
40
-
41
-
 42
42 -
 43
43 -
 44
44 -
 45
45 -
 46
46 -
 47
47 -
 48
48 -
 49
49 -
 50
50 -
 51
51 -
 52
52 -
 53
53 -
 54
54 -
 55
55 -
 56
56 -
 57
57 -
 58
58 -
 59
59 -
 60
60 -
 61
61 -
 62
62 -
63
-
64
-
65
-
66
-
67
-
68
-
69
-
70
-
71
-
72
-
73
-
74
-
75
-
76
-
77
-
78
-
79
-
80
-
81
-
82
-
83
-
84
-
85
-
86
-
87
-
88
-
89
-
90
-
91
-
92
-
93
-
94
-
95
-
96
-
97
-
98
-
99
-
100
-
101
 |
 |

2011 ANNUAL REPORT 48
PART II
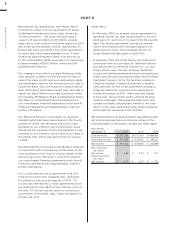
Net Debt-to-Capital was calculated as follows
(in thousands):
As of December 31,
Long-term debt, net of
current portion
Current portion of
long-term debt
Total debt
Less: Cash and cash
equivalents
Net Debt
Total shareholders’ equity
Total debt
Total debt and
shareholders’ equity
Debt-to-Capital
Net Debt
Net Debt and
shareholders’ equity
Net Debt-to-Capital
OUTLOOK
On February 2, 2012, we announced the following
initial first quarter and full year 2012 guidance:
Full Year 2012
As Reported
Constant
Currency
Net Yields Flat to 4% 1% to 5%
Net Cruise Costs per APCD 5% to 6% 6% to 7%
Net Cruise Costs per
APCD, excluding Fuel 3% to 4% 4% to 5%
Capacity Increase 2.1%
Depreciation and
Amortization $730 to $750 million
Interest Expense, net $360 to $380 million
Fuel Consumption
(metric tons) 1,354,000
Fuel Expenses $889 million
Percent Hedged
(fwd consumption) 55%
Impact of 10% change in
fuel prices $42 million
EPS $1.90 to $2.30
First Quarter 2012
As Reported
Constant
Currency
Net Yields 4% to 6% 5% to 7%
Net Cruise Costs per APCD Approx. 10% 10% to 11%
Net Cruise Costs per
APCD, excluding Fuel 5% to 6% 6% to 7%
Capacity Increase 2.5%
Depreciation and
Amortization $175 to $185 million
Interest Expense, net $82 to $92 million
Fuel Consumption
(metric tons) 341,000
Fuel Expenses $224 million
Percent Hedged
(fwd consumption) 53%
Impact of 10% change
in fuel prices $11 million
EPS $0.10 to $0.20
In providing the above guidance, we noted that prior
to the Costa Concordia incident, bookings had been
running approximately 5% higher than the same time
last year and at higher prices. Immediately after the
incident, we experienced a significant decline in new
booking activity, but cancellation activity remained at
normal levels. We believe the decline in new bookings
was driven by the extensive media coverage of the
incident and the curtailment of marketing activities by
most cruise lines and travel agencies. We also noted
that the impact on bookings was the greatest for the
first three quarters of 2012, while longer term book-
ings remained healthy.
Over the last several weeks, media coverage has
subsided and normal marketing activity has resumed.
During this period, we have continued to experience a
slow improvement in year-over-year revenue build but
the pace of bookings is still lower than at the same
time last year and lower when compared to the rate
of revenue build we were experiencing prior to the
tragedy. While booking patterns have not yet stabi-
lized and a high degree of uncertainty remains, our
total booked load factors as of the date of this filing
are at approximately the same level as at this same
time last year and at modestly higher prices.
As is always the case when evaluating booking activity
and expectations over diverse itineraries and markets,
it is difficult to reduce the volumes of data to a simple
pattern. Nevertheless, the general direction and tone
of the market so far are consistent with our earlier
expectations as indicated in our February 2, 2012
guidance, and our outlook for Net Yields and Net
Cruise Costs excluding fuel is essentially unchanged for
the first quarter and for the full year of 2012. Further-
more, we continue to believe that the tragedy will not
have a significant long-term impact on our business.
In addition, we noted the following changes since our
February 2, 2012 announcement:
Fuel Prices Fuel prices have increased since our previ-
ous guidance. While we do not forecast fuel prices,
based on current at the pump prices net of hedging,
our fuel costs for the first quarter and full year of 2012
are estimated to be $229 million and $921 million,
respectively.
Currency Impacts The United States dollar has weak-
ened relative to other currencies in which we transact
business. A weaker United States dollar tends to
improve revenues and, to a lesser extent, increase
expenses. The weakening United States dollar thus
has had a net positive impact of approximately $0.04
which has offset some of the increased fuel expense.