Royal Caribbean Cruise Lines 2011 Annual Report Download - page 53
Download and view the complete annual report
Please find page 53 of the 2011 Royal Caribbean Cruise Lines annual report below. You can navigate through the pages in the report by either clicking on the pages listed below, or by using the keyword search tool below to find specific information within the annual report.-
 1
1 -
2
-
3
-
4
-
5
-
6
-
7
-
8
-
9
-
10
-
11
-
12
-
13
-
14
-
15
-
16
-
17
-
18
-
19
-
20
-
21
-
22
-
23
-
24
-
25
-
26
-
27
-
28
-
29
-
30
-
31
-
32
-
33
-
34
-
35
-
36
-
37
-
38
-
39
-
40
-
41
-
42
-
 43
43 -
 44
44 -
 45
45 -
 46
46 -
 47
47 -
 48
48 -
 49
49 -
 50
50 -
 51
51 -
 52
52 -
 53
53 -
 54
54 -
 55
55 -
 56
56 -
 57
57 -
 58
58 -
 59
59 -
 60
60 -
 61
61 -
 62
62 -
 63
63 -
64
-
65
-
66
-
67
-
68
-
69
-
70
-
71
-
72
-
73
-
74
-
75
-
76
-
77
-
78
-
79
-
80
-
81
-
82
-
83
-
84
-
85
-
86
-
87
-
88
-
89
-
90
-
91
-
92
-
93
-
94
-
95
-
96
-
97
-
98
-
99
-
100
-
101
 |
 |

PART II
ROYAL CARIBBEAN CRUISES LTD. 49
Capacity There has been one minor change impacting
capacity. We previously expected a 2.1% increase in capac
-
ity, primarily driven by the addition of Celebrity
Silhouette, which entered service during the third
quarter of 2011. We recently agreed to charter
Pullmantur’s Ocean Dream to a third party for 6 to
10 years beginning in April 2012. This will slightly
reduce our capacity growth to about 1.5% in 2012.
This change is not expected to have a material impact
on our results.
Except for the items noted above, our expectations
for 2012 results have not changed materially since our
announcement on February 2, 2012.
YEAR ENDED DECEMBER 31, 2011 COMPARED TO
YEAR ENDED DECEMBER 31, 2010
In this section, references to 2011 refer to the year
ended December 31, 2011 and references to 2010 refer
to the year ended December 31, 2010.
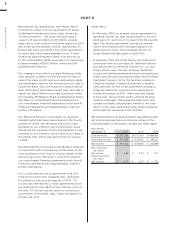
Revenues
Total revenues for 2011 increased $784.8 million or 11.6%
to $7.5 billion from $6.8 billion in 2010. Approximately
$507.8 million of this increase was attributable to a
7.5% increase in capacity. The increase in capacity
was primarily due to a full year of revenue gener -
ated by Allure of the Seas which entered service in
December 2010, the addition of Celebrity Silhouette
which entered service in July 2011, and a full year of
Celebrity Eclipse which entered service in April 2010.
This increase in capacity was partially offset by the
sale of Celebrity Mercury to TUI Cruises in February
2011. In addition, approximately $277.0 million of the
increase in revenue was driven by an increase in ticket
prices and the favorable effect of changes in foreign
currency exchange rates related to our revenue trans-
actions denominated in currencies other than the
United States dollar. These increases were partially
mitigated by the impact of geopolitical events includ-
ing the political unrest in the Eastern Mediterranean
and Northern Africa and the earthquake and related
events in Japan which offset pricing improvements in
other regions. These events resulted in deployment
changes to avoid calling on ports in those areas and
pricing reductions to stimulate demand in other areas.
Onboard and other revenues included concession
revenues of $273.4 million in 2011 compared to $237.0
million for the same period in 2010. The increase in
concession revenues was due to an increase in spend-
ing on a per passenger basis and the increase in
capacity mentioned above.
Cruise Operating Expenses
Total cruise operating expenses for 2011 increased
$484.5 million or 10.9% to $4.9 billion from $4.5 billion
for 2010. Approximately $335.2 million of the increase
was attributable to the 7.5% increase in capacity
mentioned above. Other significant drivers of the
increase include an increase in fuel, air and other
hotel and vessel expenses and head taxes, as well as
the unfavorable effect of changes in foreign currency
exchange rates related to our cruise operating expenses
denominated in currencies other than the United States
dollar. Fuel expenses, which are net of the financial
impact of fuel swap agreements, increased 18.4% per
metric ton in 2011 as compared to 2010 primarily as a
result of increasing fuel prices. The increase in air and
other hotel and vessel expenses and head taxes were
primarily due to deployment changes.
Marketing, Selling and Administrative Expenses
Marketing, selling and administrative expenses for
2011 increased $112.5 million or 13.3% to $960.6 million
from $848.1 million for 2010. The increase was due to
an increase in marketing, selling and payroll expenses
primarily associated with our international expansion
and, to a much lesser extent, an increase in expenses
associated with technological innovations.
Depreciation and Amortization Expenses
Depreciation and amortization expenses for 2011
increased $58.7 million or 9.1% to $702.4 million from
$643.7 million for 2010. The increase is primarily due to
a full year of Allure of the Seas which entered service
in December 2010, the addition of Celebrity Silhouette
which entered service in July 2011, and a full year of
Celebrity Eclipse which entered service in April 2010.
These increases were partially offset by the sale of
Celebrity Mercury to TUI Cruises and the sale of
Bleu de France.
Other Income (Expense)
Interest expense, net of interest capitalized, increased
to $382.4 million in 2011 from $371.2 million in 2010.
The increase was due to a reduction in interest capi-
talized for ships under construction. Interest capitalized
decreased to $14.0 million in 2011 from $28.1 million in
2010 primarily due to a lower average level of invest-
ment in ships under construction. Gross interest expense
decreased to $396.4 million from $399.3 million in
2010. The decrease was primarily due to lower interest
rates partially offset by a higher average debt level.
Other income decreased to $32.9 million in 2011 from
$75.0 million in 2010. The $42.1 million decrease in other
income was due primarily to an $89.0 million gain
recorded from a litigation settlement during 2010 that
did not recur in 2011, which was partially offset by:
đƫƫ*+)!ƫ+*ƫ+1.ƫ%*2!/0)!*0/ƫ%*ƫ1*+*/+(% 0! ƫ/1-
sidiaries of $22.2 million in 2011 as compared to
income of $0.2 million in 2010, for a net increase of
$22.0 million when comparing these periods;