Royal Caribbean Cruise Lines 2011 Annual Report Download - page 89
Download and view the complete annual report
Please find page 89 of the 2011 Royal Caribbean Cruise Lines annual report below. You can navigate through the pages in the report by either clicking on the pages listed below, or by using the keyword search tool below to find specific information within the annual report.-
 1
1 -
2
-
3
-
4
-
5
-
6
-
7
-
8
-
9
-
10
-
11
-
12
-
13
-
14
-
15
-
16
-
17
-
18
-
19
-
20
-
21
-
22
-
23
-
24
-
25
-
26
-
27
-
28
-
29
-
30
-
31
-
32
-
33
-
34
-
35
-
36
-
37
-
38
-
39
-
40
-
41
-
42
-
43
-
44
-
45
-
46
-
47
-
48
-
49
-
50
-
51
-
52
-
53
-
54
-
55
-
56
-
57
-
58
-
59
-
60
-
61
-
62
-
63
-
64
-
65
-
66
-
67
-
68
-
69
-
70
-
71
-
72
-
73
-
74
-
75
-
76
-
77
-
78
-
 79
79 -
 80
80 -
 81
81 -
 82
82 -
 83
83 -
 84
84 -
 85
85 -
 86
86 -
 87
87 -
 88
88 -
 89
89 -
 90
90 -
 91
91 -
 92
92 -
 93
93 -
 94
94 -
 95
95 -
 96
96 -
 97
97 -
 98
98 -
 99
99 -
100
-
101
 |
 |

NOTES TO THE CONSOLIDATED FINANCIAL STATEMENTS
ROYAL CARIBBEAN CRUISES LTD. 85
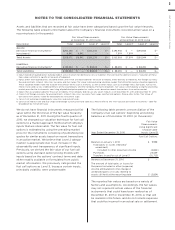
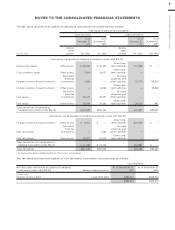
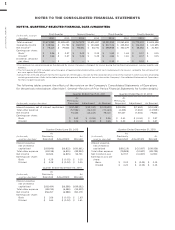
Assets and liabilities that are recorded at fair value have been categorized based upon the fair value hierarchy.
The following table presents information about the Company’s financial instruments recorded at fair value on a
recurring basis (in thousands):
Fair Value Measurements Fair Value Measurements
at December 31, 2011 Using at December 31, 2010 Using
Description Total Level 11Level 22Level 33Total Level 11Level 22Level 33
Assets:
Derivative financial instruments4 — — — —
Investments5 — — — —
Total Assets — —
Liabilities:
Derivative financial instruments6 — — — —
Total Liabilities — — — —
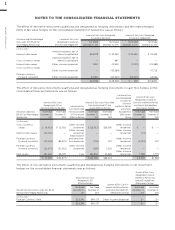
Inputs based on quoted prices (unadjusted) in active markets for identical assets or liabilities that we have the ability to access. Valuation of these
items does not entail a significant amount of judgment.
2. Inputs other than quoted prices included within Level 1 that are observable for the asset or liability, either directly or indirectly. For foreign currency
forward contracts, interest rate, cross currency and fuel swaps, fair value is derived using valuation models that utilize the income valuation approach.
These valuation models take into account the contract terms such as maturity, as well as other inputs such as exchange rates, fuel types, fuel curves,
interest rate yield curves, creditworthiness of the counterparty and the Company. For fuel call options, fair value is estimated by using the prevailing
market price for the instruments consisting of published price quotes for similar assets based on recent transactions in an active market.
3. Inputs that are unobservable for the asset or liability. The Company did not use any Level 3 inputs as of December 31, 2011 and December 31, 2010.
4. Consists of foreign currency forward contracts, interest rate, cross currency, fuel swaps and fuel call options. Please refer to the “Fair Value of
Derivative Instruments” table for breakdown by instrument type.
5. Consists of exchange-traded equity securities and mutual funds.
6. Consists of interest rate and fuel swaps and foreign currency forward contracts. Please refer to the “Fair Value of Derivative Instruments” table for
breakdown by instrument type.
We do not have financial instruments measured at fair
value within the third level of the fair value hierarchy
as of December 31, 2011. During the fourth quarter of
2010, we changed our valuation technique for fuel call
options to a market approach method which employs
inputs that are observable. The fair value for fuel call
options is estimated by using the prevailing market
price for the instruments consisting of published price
quotes for similar assets based on recent transactions
in an active market. We believe that Level 2 catego-
rization is appropriate due to an increase in the
observability and transparency of significant inputs.
Previously, we derived the fair value of our fuel call
options using standard option pricing models with
inputs based on the options’ contract terms and data
either readily available or formulated from public
market information. We previously categorized the
fuel call options as Level 3, because certain inputs,
principally volatility, were unobservable.
The following table presents a reconciliation of the
Company’s fuel call options’ beginning and ending
balances as of December 31, 2010 (in thousands):
Fair Value
Measurements
Using Significant
Unobservable
Year Ended December 31, 2010 Inputs (Level 3)
Fuel Call Options
Balance at January 1, 2010
Total gains or losses (realized/
unrealized)
Included in other (expense) income ()
Purchases
Transfers in and/or out of Level 3 ()
Balance at December 31, 2010 —
The amount of total gains or losses for
the period included in other (expense)
income attributable to the change in
unrealized gains or losses relating to
assets still held at the reporting date ()
The reported fair values are based on a variety of
factors and assumptions. Accordingly, the fair values
may not represent actual values of the financial
instruments that could have been realized as of
December 31, 2011 or December 31, 2010, or that will
be realized in the future, and do not include expenses
that could be incurred in an actual sale or settlement.