Redbox 2007 Annual Report Download - page 48
Download and view the complete annual report
Please find page 48 of the 2007 Redbox annual report below. You can navigate through the pages in the report by either clicking on the pages listed below, or by using the keyword search tool below to find specific information within the annual report.-
 1
1 -
2
-
3
-
4
-
5
-
6
-
7
-
8
-
9
-
10
-
11
-
12
-
13
-
14
-
15
-
16
-
17
-
18
-
19
-
20
-
21
-
22
-
23
-
24
-
25
-
26
-
27
-
28
-
29
-
30
-
31
-
32
-
33
-
34
-
35
-
36
-
37
-
 38
38 -
 39
39 -
 40
40 -
 41
41 -
 42
42 -
 43
43 -
 44
44 -
 45
45 -
 46
46 -
 47
47 -
 48
48 -
 49
49 -
 50
50 -
 51
51 -
 52
52 -
 53
53 -
 54
54 -
 55
55 -
 56
56 -
 57
57 -
 58
58 -
59
-
60
-
61
-
62
-
63
-
64
-
65
-
66
-
67
-
68
-
69
-
70
-
71
-
72
 |
 |

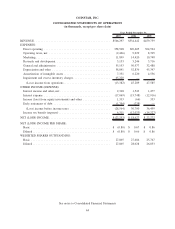
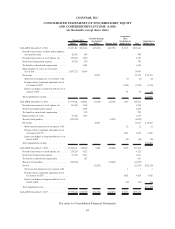
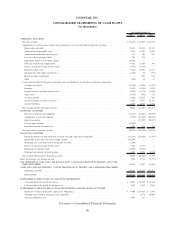
COINSTAR, INC.
CONSOLIDATED STATEMENTS OF CASH FLOWS
(in thousands)
2007 2006 2005
Year Ended December 31,
OPERATING ACTIVITIES:
Net (loss) income . . ............................................................ $(22,253) $ 18,627 $ 22,272
Adjustments to reconcile (loss) income from operations to net cash provided by operating activities:
Depreciation and other .......................................................... 58,841 52,836 45,347
Amortization of intangible assets . . .................................................. 7,331 6,220 4,556
Amortization of deferred financing fees . . . ............................................. 712 760 785
Loss on early retirement of debt . . .................................................. 1,794 238 —
Impairment and excess inventory charges . . ............................................. 65,220 — —
Non-cash stock-based compensation .................................................. 6,421 6,258 340
Excess tax benefit on share based awards . . ............................................. (3,764) (1,033) —
Deferred income taxes . . . ....................................................... (9,142) 10,183 14,315
(Income) loss from equity investments . . . ............................................. (1,624) 66 (353)
Return on equity investments ...................................................... — 929 974
Other . ................................................................... (656) 38 41
Cash (used) provided by changes in operating assets and liabilities, net of effects of business acquisitions:
Accounts receivable............................................................ (27,016) (8,464) (2,159)
Inventory .................................................................. (3,547) (9,253) 2,920
Prepaid expenses and other current assets . . ............................................. (8,594) (3,138) (2,480)
Other assets ................................................................ (4,773) (444) 172
Accounts payable . ............................................................ (7,624) 25,507 880
Accrued liabilities payable to retailers ................................................. 2,535 9,977 12,722
Accrued liabilities . ............................................................ 4,205 6,073 2,791
Net cash provided by operating activities . . . ............................................. 58,066 115,380 103,123
INVESTING ACTIVITIES:
Purchase of property and equipment .................................................. (84,318) (45,867) (43,905)
Acquisitions, net of cash acquired . .................................................. (7,249) (31,254) (20,832)
Equity investments ............................................................ — (12,109) (20,327)
Loan to equity investee . . ....................................................... (10,000) — —
Proceeds from sale of fixed assets . .................................................. 2,294 254 432
Net cash used by investing activities . .................................................. (99,273) (88,976) (84,632)
FINANCING ACTIVITIES:
Principal payments on long-term debt, revolver loan and capital lease obligations . ...................... (338,543) (24,209) (3,762)
Borrowings on previous and current credit facilities ........................................ 400,500 — —
Financing costs associated with revolving line of credit . . .................................... (1,692) — —
Excess tax benefit on share based awards . . ............................................. 3,764 1,033 —
Repurchase of common stock ...................................................... (10,025) (8,023) —
Proceeds from exercise of stock options. . . ............................................. 4,281 5,357 5,548
Net cash provided (used) by financing activities . . . ......................................... 58,285 (25,842) 1,786
Effect of exchange rate changes on cash .................................................. 1,350 2,335 (1,797)
NET INCREASE IN CASH AND CASH EQUIVALENTS, CASH IN MACHINE OR IN TRANSIT, AND CASH
BEING PROCESSED ............................................................ 18,428 2,897 18,480
CASH AND CASH EQUIVALENTS, CASH IN MACHINE OR IN TRANSIT, AND CASH BEING PROCESSED:
Beginning of period ........................................................... 178,164 175,267 156,787
End of period . . . ............................................................ $196,592 $178,164 $175,267
SUPPLEMENTAL DISCLOSURE OF CASH FLOW INFORMATION:
Cash paid during the period for interest . . . ............................................. $ 18,901 $ 14,795 $ 11,516
Cash paid during the period for income taxes . . . ......................................... 3,480 1,982 1,089
SUPPLEMENTAL DISCLOSURES OF NONCASH INVESTING AND FINANCING ACTIVITIES:
Purchase of vehicles financed by capital lease obligations . .................................... $ 9,700 $ 13,811 $ 2,280
Common stock issued in conjuction with acquisition ........................................ — 1,673 39,969
Accrued acquisition costs . ....................................................... 1,051 217 —
See notes to Consolidated Financial Statements
46