Redbox 2007 Annual Report Download - page 22
Download and view the complete annual report
Please find page 22 of the 2007 Redbox annual report below. You can navigate through the pages in the report by either clicking on the pages listed below, or by using the keyword search tool below to find specific information within the annual report.-
 1
1 -
2
-
3
-
4
-
5
-
6
-
7
-
8
-
9
-
10
-
11
-
 12
12 -
 13
13 -
 14
14 -
 15
15 -
 16
16 -
 17
17 -
 18
18 -
 19
19 -
 20
20 -
 21
21 -
 22
22 -
 23
23 -
 24
24 -
 25
25 -
 26
26 -
 27
27 -
 28
28 -
 29
29 -
 30
30 -
 31
31 -
 32
32 -
33
-
34
-
35
-
36
-
37
-
38
-
39
-
40
-
41
-
42
-
43
-
44
-
45
-
46
-
47
-
48
-
49
-
50
-
51
-
52
-
53
-
54
-
55
-
56
-
57
-
58
-
59
-
60
-
61
-
62
-
63
-
64
-
65
-
66
-
67
-
68
-
69
-
70
-
71
-
72
 |
 |

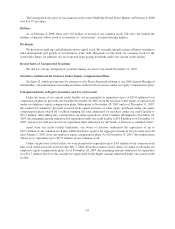
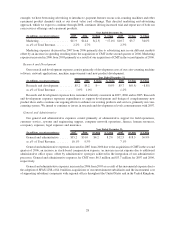
The following table summarizes information regarding shares repurchased during the quarter ended Decem-
ber 31, 2007:
Total Number
of Shares
Repurchased
Average
Price Paid
per Share
Total Number
of Shares
Purchased as
Part of the
Publicly Announced
Repurchase Programs
Maximum
Approximate
Dollar Value
of Shares that
May Yet be
Purchased Under
the Programs
October 1 - 31, 2007 .......... — — — $11,593,687
November 1 - 19, 2007 ........ — — — 11,665,097
November 20 - 30, 2007 ....... — — — 21,275,984
December 1 - 31, 2007 ........ 238,142 $27.42 238,142 14,965,596
238,142 $27.42 238,142 $14,965,596
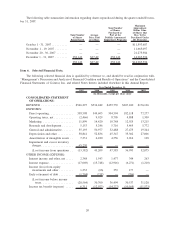
Item 6. Selected Financial Data.
The following selected financial data is qualified by reference to, and should be read in conjunction with,
“Management’s Discussion and Analysis of Financial Condition and Results of Operations” and the Consolidated
Financial Statements of Coinstar, Inc. and related Notes thereto included elsewhere in this Annual Report.
2007 2006 2005 2004 2003
Year Ended December 31,
(In thousands, except per share data)
CONSOLIDATED STATEMENT
OF OPERATIONS:
REVENUE .................... $546,297 $534,442 $459,739 $307,100 $176,136
EXPENSES:
Direct operating ............... 358,508 349,605 304,594 182,118 77,277
Operating taxes, net ............ (2,466) 9,929 8,705 4,808 1,309
Marketing ................... 11,899 14,420 10,748 12,925 13,215
Research and development ....... 5,153 5,246 5,716 5,465 5,772
General and administrative ....... 55,193 50,977 32,488 27,475 19,344
Depreciation and other . . . ....... 58,841 52,836 45,347 35,302 27,006
Amortization of intangible assets . . 7,331 6,220 4,556 2,014 138
Impairment and excess inventory
charges.................... 65,220 — — — —
(Loss) income from operations . . (13,382) 45,209 47,585 36,993 32,075
OTHER INCOME (EXPENSE):
Interest income and other, net ..... 2,348 1,543 1,477 344 263
Interest expense ............... (17,069) (15,748) (12,916) (6,271) (1,210)
Income (loss) from equity
investments and other . . ....... 1,333 (66) 353 177 —
Early retirement of debt ......... (1,794) (238) — (706) —
(Loss) income before income
taxes.................... (28,564) 30,700 36,499 30,537 31,128
Income tax benefit (expense) ..... 6,311 (12,073) (14,227) (10,169) (11,573)
20