Redbox 2007 Annual Report Download - page 29
Download and view the complete annual report
Please find page 29 of the 2007 Redbox annual report below. You can navigate through the pages in the report by either clicking on the pages listed below, or by using the keyword search tool below to find specific information within the annual report.-
 1
1 -
2
-
3
-
4
-
5
-
6
-
7
-
8
-
9
-
10
-
11
-
12
-
13
-
14
-
15
-
16
-
17
-
18
-
 19
19 -
 20
20 -
 21
21 -
 22
22 -
 23
23 -
 24
24 -
 25
25 -
 26
26 -
 27
27 -
 28
28 -
 29
29 -
 30
30 -
 31
31 -
 32
32 -
 33
33 -
 34
34 -
 35
35 -
 36
36 -
 37
37 -
 38
38 -
 39
39 -
40
-
41
-
42
-
43
-
44
-
45
-
46
-
47
-
48
-
49
-
50
-
51
-
52
-
53
-
54
-
55
-
56
-
57
-
58
-
59
-
60
-
61
-
62
-
63
-
64
-
65
-
66
-
67
-
68
-
69
-
70
-
71
-
72
 |
 |

additional coin-counting, e-payment, and DVD machines and therefore, expect to continue to experience revenue
growth in these areas in the foreseeable future.
We believe that the decrease in our entertainment services revenues in 2007 from 2006 is due to several factors,
including the decrease in foot traffic among the United States’ retailers, the China lead paint scare and the status of
the United States’ economy. We expect that these factors will continue to negatively affect our entertainment
services business in 2008. Additionally, we expect our entertainment services revenue to further decrease in 2008 as
a result of our agreement reached with Wal-Mart to remove of approximately 50% of our cranes, bulk heads, and
kiddie rides from our existing Wal-Mart locations during the first two quarters of 2008. Our entertainment services
revenues increased in 2006 from 2005 as a result of the acquisition of Amusement Factory in the fourth quarter of
2005 and an increase in machines installed.
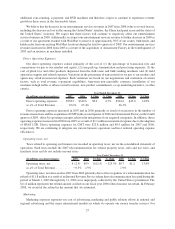
Direct Operating Expenses
Our direct operating expenses consist primarily of the cost of (1) the percentage of transaction fees and
commissions we pay to our retailers and agents, (2) coin pick-up, transportation and processing expenses, (3) the
cost of plush toys and other products dispensed from the skill-crane and bulk-vending machines and (4) field
operations support and related expenses. Variations in the percentage of transaction fees we pay to our retailers and
agents may result in increased expenses. Such variations are based on our negotiations and evaluation of certain
factors, such as total revenue, e-payment capabilities, long-term non-cancelable contracts, installation of our
machines in high traffic or urban or rural locations, new product commitments, co-op marketing incentive, or other
criteria.
(In millions, except percentages) 2007 2006 $ Chng % Chng 2005 $ Chng % Chng
Year Ended December 31,
Direct operating expenses . . . $358.5 $349.6 $8.9 2.5% $304.6 $45.0 14.8%
as a% of Total Revenue ..... 65.6% 65.4% 66.3%
Direct operating expenses increased in 2007 and in 2006 primarily as result of an increase in the number of
revenue transactions and the acquisition of CMT in the second quarter of 2006 and Amusement Factory in the fourth
quarter of 2005, offset by operating synergies achieved in integration of our acquired companies. In addition, direct
operating expenses increased in 2006 from 2005 as a result of $1.1 million incremental expense due to the adoption
of SFAS 123R. Direct operating expenses for CMT were $22.8 million and $8.5 million for 2007 and 2006,
respectively. We are continuing to integrate our various business operations and have realized operating expense
efficiencies.
Operating taxes, net
Taxes related to operating our business are recorded in operating taxes, net on the consolidated statement of
operations. Such taxes include the 2007 telecommunication fee refund, property taxes, sales and use taxes, and
franchise taxes and do not include income taxes.
(In millions, except percentages) 2007 2006 $ Chng % Chng 2005 $ Chng % Chng
Year Ended December 31,
Operating taxes, net ........... $ (2.5) $9.9 $(12.4) ⫺125.3% $8.7 $1.2 13.8%
as a% of Total Revenue ........ ⫺0.5% 1.9% 1.9%
Operating taxes, net decreased in 2007 from 2006 primarily due to the recognition of a telecommunication fee
refund of $11.8 million as a result of an Internal Revenue Service ruling that telecommunication fees paid during the
period of March 1, 2003 through July 31, 2006 were improperly collected by the United States government. The
$11.8 million represents the refund amount as filed on our fiscal year 2006 federal income tax return. In February
2008, we received the refund in the amount that we estimated.
Marketing
Marketing expenses represent our cost of advertising, marketing and public relation efforts in national and
regional advertising and the major international markets in which we operate our money transfer services. For
27