Redbox 2007 Annual Report Download - page 23
Download and view the complete annual report
Please find page 23 of the 2007 Redbox annual report below. You can navigate through the pages in the report by either clicking on the pages listed below, or by using the keyword search tool below to find specific information within the annual report.-
 1
1 -
2
-
3
-
4
-
5
-
6
-
7
-
8
-
9
-
10
-
11
-
12
-
 13
13 -
 14
14 -
 15
15 -
 16
16 -
 17
17 -
 18
18 -
 19
19 -
 20
20 -
 21
21 -
 22
22 -
 23
23 -
 24
24 -
 25
25 -
 26
26 -
 27
27 -
 28
28 -
 29
29 -
 30
30 -
 31
31 -
 32
32 -
 33
33 -
34
-
35
-
36
-
37
-
38
-
39
-
40
-
41
-
42
-
43
-
44
-
45
-
46
-
47
-
48
-
49
-
50
-
51
-
52
-
53
-
54
-
55
-
56
-
57
-
58
-
59
-
60
-
61
-
62
-
63
-
64
-
65
-
66
-
67
-
68
-
69
-
70
-
71
-
72
 |
 |

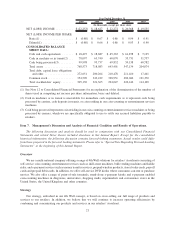
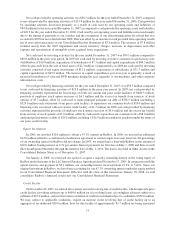
2007 2006 2005 2004 2003
Year Ended December 31,
(In thousands, except per share data)
NET (LOSS) INCOME ........... $(22,253) $ 18,627 $ 22,272 $ 20,368 $ 19,555
NET (LOSS) INCOME PER SHARE:
Basic(1) ..................... $ (0.80) $ 0.67 $ 0.86 $ 0.94 $ 0.91
Diluted(1) ................... $ (0.80) $ 0.66 $ 0.86 $ 0.93 $ 0.90
CONSOLIDATED BALANCE
SHEET DATA:
Cash and cash equivalents ....... $ 18,497 $ 18,687 $ 45,365 $ 61,878 $ 7,125
Cash in machine or in transit(2) . . . 78,097 63,740 60,070 35,751 31,757
Cash being processed(3) ......... 99,998 95,737 69,832 59,158 60,782
Total assets .................. 768,573 718,083 643,401 547,134 204,074
Total debt, capital lease obligations
and other .................. 272,651 200,264 210,478 211,410 17,461
Common stock ................ 354,509 343,229 328,951 282,046 191,370
Total stockholders’ equity ........ 305,130 321,365 294,047 226,146 114,190
(1) See Note 12 to Consolidated Financial Statements for an explanation of the determination of the number of
shares used in computing net income per share information, basic and diluted.
(2) Cash in machines or in transit is unavailable for immediate cash requirements as it represents cash being
processed by carriers, cash deposits in transit, or coin residing in our coin-counting or entertainment services
machines.
(3) Cash being processed represents coin residing in our coin-counting or entertainment services machines or being
processed by carriers, which we are specifically obligated to use to settle our accrued liabilities payable to
retailers.
Item 7. Management’s Discussion and Analysis of Financial Condition and Results of Operations.
The following discussion and analysis should be read in conjunction with our Consolidated Financial
Statements and related Notes thereto included elsewhere in this Annual Report. Except for the consolidated
historical information, the following discussion contains forward-looking statements. Actual results could differ
from those projected in the forward- looking statements. Please refer to “Special Note Regarding Forward-Looking
Statements” at the beginning of this Annual Report.
Overview
We are a multi-national company offering a range of 4th Wall solutions for retailers’ storefronts consisting of
self-service coin counting; entertainment services such as skill-crane machines, bulk vending machines and kiddie
rides; and e-payment services such as money transfer services, prepaid wireless products, stored value cards, payroll
cards and prepaid debit cards. In addition, we offer self-service DVD kiosks where consumers can rent or purchase
movies. We also offer a range of point-of-sale terminals, stand-alone e-payment kiosks and e-payment enabled
coin-counting machines in drugstores, universities, shopping malls, supermarkets and convenience stores in the
United States, the United Kingdom and other countries.
Strategy
Our strategy, embodied in our 4th Wall concept, is based on cross-selling our full range of products and
services to our retailers. In addition, we believe that we will continue to increase operating efficiencies by
combining and concentrating our products and services in our retailers’ storefront.
21