Redbox 2007 Annual Report Download - page 31
Download and view the complete annual report
Please find page 31 of the 2007 Redbox annual report below. You can navigate through the pages in the report by either clicking on the pages listed below, or by using the keyword search tool below to find specific information within the annual report.-
 1
1 -
2
-
3
-
4
-
5
-
6
-
7
-
8
-
9
-
10
-
11
-
12
-
13
-
14
-
15
-
16
-
17
-
18
-
19
-
20
-
 21
21 -
 22
22 -
 23
23 -
 24
24 -
 25
25 -
 26
26 -
 27
27 -
 28
28 -
 29
29 -
 30
30 -
 31
31 -
 32
32 -
 33
33 -
 34
34 -
 35
35 -
 36
36 -
 37
37 -
 38
38 -
 39
39 -
 40
40 -
 41
41 -
42
-
43
-
44
-
45
-
46
-
47
-
48
-
49
-
50
-
51
-
52
-
53
-
54
-
55
-
56
-
57
-
58
-
59
-
60
-
61
-
62
-
63
-
64
-
65
-
66
-
67
-
68
-
69
-
70
-
71
-
72
 |
 |

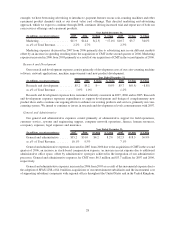
Depreciation and Other
Our depreciation and other expenses consist primarily of depreciation charges on our installed coin-counting
and entertainment services machines as well as on computer equipment and leased automobiles.
(In millions, except percentages) 2007 2006 $ Chng % Chng 2005 $ Chng % Chng
Year Ended December 31,
Depreciation and other......... $58.8 $52.8 $6.0 11.4% $45.3 $7.5 16.6%
as a% of Total Revenue ........ 10.8% 9.9% 9.9%
Depreciation and other expense increased in 2007 and in 2006 primarily due to our various acquisitions during
these periods as well as an increase in our capital expenditures primarily related to new and upgrades to existing
coin-counting and entertainment machines.
Amortization of Intangible Assets
Our amortization expense consists of amortization of intangible assets, which are mainly comprised of the
value assigned to our acquired retailer relationships and, to a lesser extent, internally developed software.
(In millions, except percentages) 2007 2006 $ Chng % Chng 2005 $ Chng % Chng
Year Ended December 31,
Amortization of intangible assets .... $7.3 $6.2 $1.1 17.7% $4.6 $1.6 34.8%
as a% of Total Revenue .......... 1.3% 1.2% 1.0%
Amortization of intangible assets increased in 2007 and in 2006 due to the full-year amortization related to our
various acquisitions, including CMT in 2006.
Impairment and excess inventory charges
(In millions, except percentages) 2007 2006 $ Chng % Chng 2005 $ Chng % Chng
Year Ended December 31,
Impairment and excess inventory
charges .................... $65.2 $ — $65.2 100.0% $ — $— 0.0%
as a% of Total Revenue ......... 11.9% 0.0% 0.0%
Prior to December 31, 2007, Wal-Mart management expressed its intent to reset and optimize its store
entrances. In February 2008, we reached an agreement with Wal-Mart to significantly expand our coin-counting
machines and our DVD kiosks locations over the next 12 to 18 months. In conjunction with the expansion, we will
be removing approximately 50% of our cranes, bulk heads, and kiddie rides from our existing Wal-Mart locations.
As a result, we recorded a non-cash impairment charge of $65.2 million as of December 31, 2007 included in the
Consolidated Statement of Operations related to an asset group that includes this equipment and certain intangible
assets. Of this amount, $52.6 million relates to the impairment of these cranes, bulk heads, and kiddie rides,
$7.9 million relates to the impairment of intangible assets and $4.7 million relates to the write-off of inventory.
Other Income and Expense
(In millions, except percentages) 2007 2006 $ Chng % Chng 2005 $ Chng % Chng
Year Ended December 31,
Interest income and other,
net.................. $ 2.3 $ 1.5 $0.8 53.3% $ 1.5 $ — 0.0%
Interest expense .......... $(17.1) $(15.7) $(1.4) 8.9% $(12.9) $(2.8) 21.7%
Income (loss) from equity
investments and other . . . . $ 1.3 $ (0.1) $ 1.4 ⫺1400.0% $ 0.4 $(0.5) ⫺125.0%
Early retirement of debt .... $ (1.8) $ (0.2) $(1.6) 800.0% $ — $(0.2) 100.0%
29