Redbox 2007 Annual Report Download - page 32
Download and view the complete annual report
Please find page 32 of the 2007 Redbox annual report below. You can navigate through the pages in the report by either clicking on the pages listed below, or by using the keyword search tool below to find specific information within the annual report.-
 1
1 -
2
-
3
-
4
-
5
-
6
-
7
-
8
-
9
-
10
-
11
-
12
-
13
-
14
-
15
-
16
-
17
-
18
-
19
-
20
-
21
-
 22
22 -
 23
23 -
 24
24 -
 25
25 -
 26
26 -
 27
27 -
 28
28 -
 29
29 -
 30
30 -
 31
31 -
 32
32 -
 33
33 -
 34
34 -
 35
35 -
 36
36 -
 37
37 -
 38
38 -
 39
39 -
 40
40 -
 41
41 -
 42
42 -
43
-
44
-
45
-
46
-
47
-
48
-
49
-
50
-
51
-
52
-
53
-
54
-
55
-
56
-
57
-
58
-
59
-
60
-
61
-
62
-
63
-
64
-
65
-
66
-
67
-
68
-
69
-
70
-
71
-
72
 |
 |
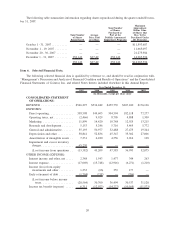
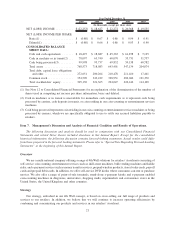
Interest income and other, net increased in 2007 from 2006 primarily due to the recognition of interest income
on our telecommunication fee refund offset by lower than average investment balances. Interest income and other,
net was unchanged in 2006 from 2005.
Interest expense increased in 2007 and in 2006 primarily due to higher outstanding debt balances, higher
interest rates and increased capital leases.
Income (loss) from equity investments and other increased in 2007 from 2006 primarily as a result of recording
our portion of the telecommunication fee refund expected to be collected by us on behalf of a related third party.
Early retirement of debt expense was $1.8 million in 2007 and $0.2 million in 2006. On November 20, 2007, in
connection with entering into our new debt facility, we retired the outstanding balance of our previous debt facility
dated July 7, 2004 resulting in a charge of $1.8 million for the write-off of deferred financing fees. The early
retirement of debt expense in 2006 relates to accelerated deferred financing fees related to our mandatory pay down
of $16.9 million under our previous debt facility in the first quarter of 2006.
Income Taxes
The effective income tax rate was 22.1% in 2007 compared with 39.3% in 2006 and 39.0% in 2005. As
illustrated in Note 11 to the Consolidated Financial Statements, the effective income tax rate for 2007 varies from
the federal statutory tax rate of 35% primarily due to a change in valuation allowance on foreign net operating
losses, the impact of changes in foreign tax rates, state income taxes, non-deductible stock-based compensation
expense recorded for incentive stock option (“ISO”) awards offset by the benefit arising for ISO disqualifying
dispositions and changes in deferred tax assets due to adjustments to state operating loss carryforwards.
The effective income tax rate for 2006 varies from the federal statutory tax rate of 35% primarily due to state
income taxes, non-deductible stock-based compensation expense recorded for ISO awards offset by the benefit
arising for ISO disqualifying dispositions, the impact of our election during the third quarter of 2006 of the
indefinite reversal criteria for unremitted foreign earnings under APB No. 23, Accounting for Income Taxes —
Special Areas (“APB 23”), the impact of adjusting our deferred tax asset associated with state operating loss
carryforwards, the impact of recognizing an increase to our available research and development credit, as well as the
impact of recognition of a valuation allowance to offsetting foreign deferred tax assets relating to our acquisition of
CMT. The effective income tax rate for 2005 varied from the federal statutory tax rate of 35% primarily due to state
income taxes.
As of December 31, 2007 and 2006, our net deferred income tax assets totaled $19.9 million and $10.3 million,
respectively. In the years ended December 31, 2007, 2006 and 2005 we recorded tax (benefit) expense of
$(6.3) million, $12.1 million and $14.2 million, respectively, which, as a result of our United States net operating
loss carryforwards, will not result in cash payments for United States federal income taxes other than federal
alternative minimum taxes. Current tax payments have been made to state and foreign jurisdictions.
Liquidity and Capital Resources
Cash and Liquidity
Our business involves collecting and processing large volumes of cash, most of it in the form of coins. We
present three categories of cash on our balance sheet: cash and cash equivalents, cash in machine or in transit, and
cash being processed.
As of December 31, 2007, we had cash and cash equivalents, cash in machine or in transit, and cash being
processed totaling $196.6 million, which consisted of cash and cash equivalents immediately available to fund our
operations of $18.5 million, cash in machine or in transit of $78.1 million and cash being processed of
$100.0 million (which relates to our partner payable liability as recorded in “accrued liabilities payable to
retailers” in the Consolidated Balance Sheet). Working capital was $104.7 million as of December 31, 2007,
compared with $73.1 million as of December 31, 2006. The increase in working capital was primarily the result of
the recognition of the receivable related to our telecommunication fee refund and the timing of payments to our
vendors and retailers.
30