Redbox 2007 Annual Report Download - page 30
Download and view the complete annual report
Please find page 30 of the 2007 Redbox annual report below. You can navigate through the pages in the report by either clicking on the pages listed below, or by using the keyword search tool below to find specific information within the annual report.-
 1
1 -
2
-
3
-
4
-
5
-
6
-
7
-
8
-
9
-
10
-
11
-
12
-
13
-
14
-
15
-
16
-
17
-
18
-
19
-
 20
20 -
 21
21 -
 22
22 -
 23
23 -
 24
24 -
 25
25 -
 26
26 -
 27
27 -
 28
28 -
 29
29 -
 30
30 -
 31
31 -
 32
32 -
 33
33 -
 34
34 -
 35
35 -
 36
36 -
 37
37 -
 38
38 -
 39
39 -
 40
40 -
41
-
42
-
43
-
44
-
45
-
46
-
47
-
48
-
49
-
50
-
51
-
52
-
53
-
54
-
55
-
56
-
57
-
58
-
59
-
60
-
61
-
62
-
63
-
64
-
65
-
66
-
67
-
68
-
69
-
70
-
71
-
72
 |
 |

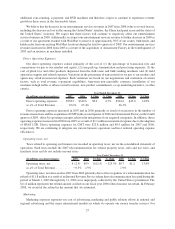
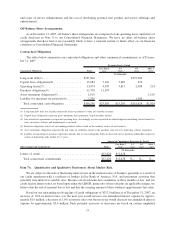
example, we have been using advertising to introduce e-payment features on our coin-counting machines and other
e-payment product channels such as our stored value card offerings. This directed marketing and advertising
approach, which we expect to continue through 2008, continues driving increased trial and repeat use of both our
coin services offerings and e-payment products.
(In millions, except percentages) 2007 2006 $ Chng % Chng 2005 $ Chng % Chng
Year Ended December 31,
Marketing . ................. $11.9 $14.4 $(2.5) ⫺17.4% $10.7 $3.7 34.6%
as a% of Total Revenue ........ 2.2% 2.7% 2.3%
Marketing expenses decreased in 2007 from 2006 primarily due to advertising mix in our different markets
offset by an increase in spending resulting from the acquisition of CMT in the second quarter of 2006. Marketing
expenses increased in 2006 from 2005 primarily as a result of our acquisition of CMT in the second quarter of 2006.
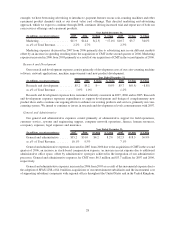
Research and Development
Our research and development expenses consist primarily of development costs of our coin-counting machine
software, network applications, machine improvements and new product development.
(In millions, except percentages) 2007 2006 $ Chng % Chng 2005 $ Chng % Chng
Year Ended December 31,
Research and development ........ $5.2 $5.2 $— 0.0% $5.7 $(0.5) ⫺8.8%
as a% of Total Revenue .......... 1.0% 1.0% 1.2%
Research and development expenses have remained relatively consistent in 2007, 2006 and in 2005. Research
and development expenses represent expenditures to support development and design of complementary new
product ideas and to continue our ongoing efforts to enhance our existing products and services, primarily our coin-
counting system. We intend to continue to invest in research and development at levels commensurate with 2007.
General and Administrative
Our general and administrative expenses consist primarily of administrative support for field operations,
customer service, systems and engineering support, computer network operations, finance, human resources,
occupancy expenses, legal expenses and insurance.
(In millions, except percentages) 2007 2006 $ Chng % Chng 2005 $ Chng % Chng
Year Ended December 31,
General and administrative ..... $55.2 $51.0 $4.2 8.2% $32.5 $18.5 56.9%
as a% of Total Revenue ........ 10.1% 9.5% 7.1%
General and administrative expenses increased in 2007 from 2006 due to the acquisition of CMT in the second
quarter of 2006, an increase in stock-based compensation expense, an increase in rent expense due to additional
administrative office space, offset by administrative synergies achieved in the integration of our administrative
processes. General and administrative expenses for CMT were $6.5 million and $3.7 million for 2007 and 2006,
respectively.
General and administrative expenses increased in 2006 from 2005 as a result of the incremental expense due to
the adoption of SFAS 123R of $4.0 million, acquisitions of our entertainment subsidiaries and the incremental cost
of supporting subsidiary companies with regional offices throughout the United States and in the United Kingdom.
28