Pottery Barn 2006 Annual Report Download - page 72
Download and view the complete annual report
Please find page 72 of the 2006 Pottery Barn annual report below. You can navigate through the pages in the report by either clicking on the pages listed below, or by using the keyword search tool below to find specific information within the annual report.-
 1
1 -
2
-
3
-
4
-
5
-
6
-
7
-
8
-
9
-
10
-
11
-
12
-
13
-
14
-
15
-
16
-
17
-
18
-
19
-
20
-
21
-
22
-
23
-
24
-
25
-
26
-
27
-
28
-
29
-
30
-
31
-
32
-
33
-
34
-
35
-
36
-
37
-
38
-
39
-
40
-
41
-
42
-
43
-
44
-
45
-
46
-
47
-
48
-
49
-
50
-
51
-
52
-
53
-
54
-
55
-
56
-
57
-
58
-
59
-
60
-
61
-
 62
62 -
 63
63 -
 64
64 -
 65
65 -
 66
66 -
 67
67 -
 68
68 -
 69
69 -
 70
70 -
 71
71 -
 72
72 -
 73
73 -
 74
74 -
 75
75 -
 76
76 -
 77
77 -
 78
78 -
 79
79 -
 80
80 -
 81
81 -
 82
82 -
83
-
84
-
85
-
86
-
87
-
88
-
89
-
90
-
91
-
92
-
93
-
94
-
95
-
96
-
97
-
98
-
99
-
100
-
101
-
102
-
103
-
104
-
105
-
106
-
107
-
108
-
109
-
110
-
111
-
112
-
113
-
114
-
115
-
116
-
117
-
118
-
119
-
120
-
121
-
122
-
123
-
124
-
125
-
126
-
127
-
128
-
129
-
130
-
131
-
132
-
133
-
134
-
135
-
136
-
137
-
138
-
139
-
140
-
141
-
142
-
143
-
144
-
145
-
146
-
147
-
148
-
149
-
150
-
151
-
152
 |
 |

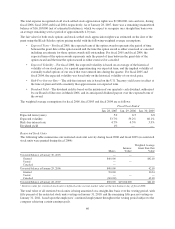
The total expense recognized on all stock-settled stock appreciation rights was $1,966,000, zero and zero, during
fiscal 2006, fiscal 2005 and fiscal 2004, respectively. As of January 28, 2007, there was a remaining unamortized
balance of $16,103,000 (net of estimated forfeitures), which we expect to recognize on a straight-line basis over
an average remaining service period of approximately 4.0 years.
The fair value for both stock options and stock-settled stock appreciation rights was estimated on the date of the
grant using the Black-Scholes option pricing model with the following weighted average assumptions:
•Expected Term – For fiscal 2006, the expected term of the option awards represents the period of time
between the grant date of the option award and the time the option award is either exercised or canceled
including an estimate for those option awards still outstanding. For fiscal 2005 and fiscal 2004, the
expected term of the option awards represents only the period of time between the grant date of the
option award and the time the option award is either exercised or canceled.
•Expected Volatility – For fiscal 2006, the expected volatility is based on an average of the historical
volatility of our stock price, for a period approximating our expected term, and the implied volatility of
externally traded options of our stock that were entered into during the quarter. For fiscal 2005 and
fiscal 2004, the expected volatility was based only on the historical volatility of our stock price.
•Risk-Free Interest Rate – The risk-free interest rate is based on the U.S. Treasury yield curve in effect at
the time of grant and with a maturity that approximates our expected term.
•Dividend Yield – The dividend yield is based on the initiation of our quarterly cash dividend, authorized
by our Board of Directors in March 2006, and its anticipated dividend payout over the expected term of
the award.
The weighted average assumptions for fiscal 2006, fiscal 2005 and fiscal 2004 are as follows:
Fiscal Year Ended
Jan. 28, 2007 Jan. 29, 2006 Jan. 30, 2005
Expected term (years) 5.0 6.5 6.8
Expected volatility 33.7% 59.2% 60.1%
Risk-free interest rate 4.7% 4.3% 3.9%
Dividend yield 1% — —
Restricted Stock Units
The following table summarizes our restricted stock unit activity during fiscal 2006 and fiscal 2005 (no restricted
stock units were granted during fiscal 2004):
Shares
Intrinsic
Value1
Weighted Average
Grant Date Fair
Value
Unvested balance at January 30, 2005 — —
Granted 840,000 $42.18
Vested — —
Canceled —
Unvested balance at January 29, 2006 840,000 42.18
Granted 70,000 30.34
Vested — — —
Canceled (60,000) 42.18
Unvested balance at January 28, 2007 850,000 $29,104,000 $41.20
1Intrinsic value for restricted stock units is defined as the current market value on the last business day of fiscal 2006.
The total value of all restricted stock units is being amortized on a straight-line basis over the vesting period, with
fifty percent of the restricted stock units vesting on January 31, 2010, and the remaining fifty percent vesting on
January 31, 2011, based upon the employees’ continued employment throughout the vesting period subject to the
company achieving certain earnings goals.
60