Pottery Barn 2006 Annual Report Download - page 55
Download and view the complete annual report
Please find page 55 of the 2006 Pottery Barn annual report below. You can navigate through the pages in the report by either clicking on the pages listed below, or by using the keyword search tool below to find specific information within the annual report.-
 1
1 -
2
-
3
-
4
-
5
-
6
-
7
-
8
-
9
-
10
-
11
-
12
-
13
-
14
-
15
-
16
-
17
-
18
-
19
-
20
-
21
-
22
-
23
-
24
-
25
-
26
-
27
-
28
-
29
-
30
-
31
-
32
-
33
-
34
-
35
-
36
-
37
-
38
-
39
-
40
-
41
-
42
-
43
-
44
-
 45
45 -
 46
46 -
 47
47 -
 48
48 -
 49
49 -
 50
50 -
 51
51 -
 52
52 -
 53
53 -
 54
54 -
 55
55 -
 56
56 -
 57
57 -
 58
58 -
 59
59 -
 60
60 -
 61
61 -
 62
62 -
 63
63 -
 64
64 -
 65
65 -
66
-
67
-
68
-
69
-
70
-
71
-
72
-
73
-
74
-
75
-
76
-
77
-
78
-
79
-
80
-
81
-
82
-
83
-
84
-
85
-
86
-
87
-
88
-
89
-
90
-
91
-
92
-
93
-
94
-
95
-
96
-
97
-
98
-
99
-
100
-
101
-
102
-
103
-
104
-
105
-
106
-
107
-
108
-
109
-
110
-
111
-
112
-
113
-
114
-
115
-
116
-
117
-
118
-
119
-
120
-
121
-
122
-
123
-
124
-
125
-
126
-
127
-
128
-
129
-
130
-
131
-
132
-
133
-
134
-
135
-
136
-
137
-
138
-
139
-
140
-
141
-
142
-
143
-
144
-
145
-
146
-
147
-
148
-
149
-
150
-
151
-
152
 |
 |

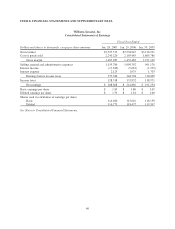
Williams-Sonoma, Inc.
Consolidated Statements of Cash Flows
Fiscal Year Ended
Dollars in thousands Jan. 28, 2007 Jan. 29, 2006 Jan. 30, 2005
Cash flows from operating activities:
Net earnings $ 208,868 $ 214,866 $ 191,234
Adjustments to reconcile net earnings to net cash provided by
(used in) operating activities:
Depreciation and amortization 135,031 123,199 111,624
Loss on disposal/impairment of assets 17,113 12,050 1,080
Amortization of deferred lease incentives (28,683) (24,909) (22,530)
Deferred income taxes (50,751) (20,791) (6,254)
Tax benefit from exercise of stock options 2,545 15,743 13,085
Stock-based compensation expense 26,813 440 —
Other — — 335
Changes in:
Accounts receivable 1,070 (6,829) (10,900)
Merchandise inventories (90,598) (67,474) (48,017)
Prepaid catalog expenses (5,684) (405) (15,056)
Prepaid expenses and other assets 5,398 9,032 (19,702)
Accounts payable 11,981 14,365 17,773
Accrued salaries, benefits and other (6,141) 15,950 9,955
Customer deposits 14,958 24,066 32,273
Deferred rent and lease incentives 49,079 27,661 42,080
Income taxes payable 18,115 11,409 7,457
Net cash provided by operating activities 309,114 348,373 304,437
Cash flows from investing activities:
Purchases of property and equipment (190,980) (151,788) (181,453)
Proceeds from insurance reimbursement 1,104 — —
Proceeds from sale of investment 589 — —
Net cash used in investing activities (189,287) (151,788) (181,453)
Cash flows from financing activities:
Proceeds from bond issuance — — 15,000
Repayments of long-term obligations (4,679) (9,235) (9,789)
Proceeds from exercise of stock options 13,935 28,002 26,190
Excess tax benefit from exercise of stock options 4,878 — —
Repurchase of common stock (185,508) (93,921) (79,320)
Payment of dividends (34,435) — —
Credit facility costs (218) (654) (288)
Net cash used in financing activities (206,027) (75,808) (48,207)
Effect of exchange rates on cash and cash equivalents 647 995 523
Net (decrease) increase in cash and cash equivalents (85,553) 121,772 75,300
Cash and cash equivalents at beginning of year 360,982 239,210 163,910
Cash and cash equivalents at end of year $ 275,429 $ 360,982 $ 239,210
Supplemental disclosure of cash flow information:
Cash paid during the year for:
Interest1$ 2,815 $ 3,352 $ 3,585
Income taxes2155,041 130,766 105,910
1Interest paid, net of capitalized interest, was $2.1 million, $2.2 million and $1.9 million in fiscal 2006, fiscal 2005 and fiscal
2004, respectively.
2Income taxes paid in fiscal 2006 is presented net of refunds of $1.7 million.
See Notes to Consolidated Financial Statements.
43
Form 10-K