Pottery Barn 2006 Annual Report Download - page 33
Download and view the complete annual report
Please find page 33 of the 2006 Pottery Barn annual report below. You can navigate through the pages in the report by either clicking on the pages listed below, or by using the keyword search tool below to find specific information within the annual report.-
 1
1 -
2
-
3
-
4
-
5
-
6
-
7
-
8
-
9
-
10
-
11
-
12
-
13
-
14
-
15
-
16
-
17
-
18
-
19
-
20
-
21
-
22
-
 23
23 -
 24
24 -
 25
25 -
 26
26 -
 27
27 -
 28
28 -
 29
29 -
 30
30 -
 31
31 -
 32
32 -
 33
33 -
 34
34 -
 35
35 -
 36
36 -
 37
37 -
 38
38 -
 39
39 -
 40
40 -
 41
41 -
 42
42 -
 43
43 -
44
-
45
-
46
-
47
-
48
-
49
-
50
-
51
-
52
-
53
-
54
-
55
-
56
-
57
-
58
-
59
-
60
-
61
-
62
-
63
-
64
-
65
-
66
-
67
-
68
-
69
-
70
-
71
-
72
-
73
-
74
-
75
-
76
-
77
-
78
-
79
-
80
-
81
-
82
-
83
-
84
-
85
-
86
-
87
-
88
-
89
-
90
-
91
-
92
-
93
-
94
-
95
-
96
-
97
-
98
-
99
-
100
-
101
-
102
-
103
-
104
-
105
-
106
-
107
-
108
-
109
-
110
-
111
-
112
-
113
-
114
-
115
-
116
-
117
-
118
-
119
-
120
-
121
-
122
-
123
-
124
-
125
-
126
-
127
-
128
-
129
-
130
-
131
-
132
-
133
-
134
-
135
-
136
-
137
-
138
-
139
-
140
-
141
-
142
-
143
-
144
-
145
-
146
-
147
-
148
-
149
-
150
-
151
-
152
 |
 |

ITEM 7. MANAGEMENT’S DISCUSSION AND ANALYSIS OF FINANCIAL CONDITION AND
RESULTS OF OPERATIONS
OVERVIEW
Fiscal 2006 Financial Results
In fiscal 2006, our net revenues increased 5.3% to $3,727,513,000 from $3,538,947,000 in fiscal 2005, with
positive growth in all brands. Despite this increase, we were negatively impacted in the back half of the year by
the significant softening in the home-centered macro-economic environment. As a result, we saw lower
direct-to-customer response rates, weaker retail traffic and an unusually high level of competitive markdown
pressure. This was particularly true in Pottery Barn, our largest brand, where revenues fell substantially short of
our expectations. There were also specific operational issues within the Pottery Barn brand, primarily in the areas
of merchandising, marketing and retail execution. A comprehensive recovery plan is underway and we expect
that we will see improvement throughout 2007 and 2008.
Diluted earnings per share decreased by 1.1% to $1.79 in fiscal 2006 from $1.81 in fiscal 2005. This decrease
included a charge of $0.11 per diluted share in fiscal 2006 related to both the expense associated with the
implementation of SFAS No. 123R, “Share-Based Payments” and FASB Staff Position (“FSP”) FAS 13-1,
“Accounting for Rental Costs Incurred During a Construction Period,” and a net benefit from the following
unusual business events: unredeemed gift certificate income due to a change in estimate, the Visa/MasterCard
litigation settlement income, expense associated with the Hold Everything transition and expense associated with
the departure of our former Chief Executive Officer (“Unusual Business Events”).
From a cash flow perspective, fiscal 2006 was another strong year, generating $309,114,000 in net cash from
operating activities, despite higher inventories and lower growth rates. In 2006, we returned nearly $219,943,000
to our shareholders through a combination of share repurchases and dividends, and we ended the year with a cash
balance of $275,429,000 after internally funding all growth and infrastructure initiatives, including $190,980,000
in capital expenditures.
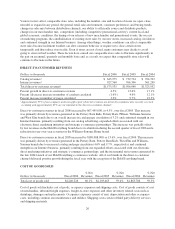
In our retail channel, net revenues in fiscal 2006 increased by $121,071,000, or 6.0%, over fiscal 2005, primarily
due to an increase in store leased square footage of 8.3% (including 18 net new stores) and comparable store
sales growth of 0.3%. Net revenues generated in the West Elm, Williams-Sonoma, Pottery Barn Kids, Williams-
Sonoma Home and the Pottery Barn brands were the primary contributors to the year-over-year revenue increase,
partially offset by lost revenues in the Hold Everything brand due to the closure of all its stores in late 2005 and
the first quarter of 2006.
In our direct-to-customer channel, net revenues in fiscal 2006 increased by $67,495,000, or 4.5%, over fiscal
2005. This increase was primarily driven by net revenues generated in the Pottery Barn Kids, Pottery Barn,
PBteen, Williams-Sonoma and West Elm brands due to an overall increase in catalog page circulation of 3.2%
and continued strength in our Internet business, which continued to be our fastest growing shopping channel,
with revenues increasing 21.0% to $927,560,000. This increase was partially offset by lost revenues in the Hold
Everything brand due to its shutdown during the second quarter of fiscal 2006 and a reduction in year-over-year
revenues in the Williams-Sonoma Home brand.
In our core brands, net revenues increased 4.7%, including an 11.5% increase in the Pottery Barn Kids brand, a
5.6% increase in the Williams-Sonoma brand and a 1.8% increase in the Pottery Barn brand. In its 50th year of
operations, the Williams-Sonoma brand reached a new milestone in profitability and, for the second consecutive
year, delivered the highest operating contribution as a percentage of net revenues in its history.
In our emerging brands, including West Elm, PBteen and Williams-Sonoma Home, revenues increased 31.4%.
This increase was primarily driven by incremental revenues from the opening of new stores in West Elm and
Williams-Sonoma Home and strong direct-to-customer growth in PBteen and West Elm. In West Elm,
incremental revenues from both existing and new stores, improved catalog response, and increased traffic in
e-commerce drove year-over-year revenue growth. We opened 10 stores in fiscal 2006, with two new stores
opening during the fourth quarter, bringing our total store count to 22 with an average square footage of
approximately 17,400 square feet. In addition, we improved our level of profitability as we made progress on our
initiatives to increase catalog productivity through higher response rates and average order sizes.
21
Form 10-K