Pottery Barn 2006 Annual Report Download - page 42
Download and view the complete annual report
Please find page 42 of the 2006 Pottery Barn annual report below. You can navigate through the pages in the report by either clicking on the pages listed below, or by using the keyword search tool below to find specific information within the annual report.-
 1
1 -
2
-
3
-
4
-
5
-
6
-
7
-
8
-
9
-
10
-
11
-
12
-
13
-
14
-
15
-
16
-
17
-
18
-
19
-
20
-
21
-
22
-
23
-
24
-
25
-
26
-
27
-
28
-
29
-
30
-
31
-
 32
32 -
 33
33 -
 34
34 -
 35
35 -
 36
36 -
 37
37 -
 38
38 -
 39
39 -
 40
40 -
 41
41 -
 42
42 -
 43
43 -
 44
44 -
 45
45 -
 46
46 -
 47
47 -
 48
48 -
 49
49 -
 50
50 -
 51
51 -
 52
52 -
53
-
54
-
55
-
56
-
57
-
58
-
59
-
60
-
61
-
62
-
63
-
64
-
65
-
66
-
67
-
68
-
69
-
70
-
71
-
72
-
73
-
74
-
75
-
76
-
77
-
78
-
79
-
80
-
81
-
82
-
83
-
84
-
85
-
86
-
87
-
88
-
89
-
90
-
91
-
92
-
93
-
94
-
95
-
96
-
97
-
98
-
99
-
100
-
101
-
102
-
103
-
104
-
105
-
106
-
107
-
108
-
109
-
110
-
111
-
112
-
113
-
114
-
115
-
116
-
117
-
118
-
119
-
120
-
121
-
122
-
123
-
124
-
125
-
126
-
127
-
128
-
129
-
130
-
131
-
132
-
133
-
134
-
135
-
136
-
137
-
138
-
139
-
140
-
141
-
142
-
143
-
144
-
145
-
146
-
147
-
148
-
149
-
150
-
151
-
152
 |
 |
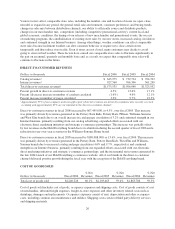
2006. In addition, in fiscal 2005, there was an increase in reserves for potential state income tax exposure, which
resulted in a higher fiscal 2005 tax rate. We currently expect our fiscal 2007 effective tax rate to be in the range
of 38.5% to 38.8%. This effective tax rate does not include any potential impact from the implementation of
FIN 48, which we will adopt in the first quarter of fiscal 2007. Throughout the year, we expect that there could
be ongoing variability in our quarterly tax rates as taxable events occur and exposures are re-evaluated.
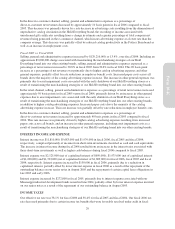
LIQUIDITY AND CAPITAL RESOURCES
As of January 28, 2007, we held $275,429,000 in cash and cash equivalent funds. As is consistent with our
industry, our cash balances are seasonal in nature, with the fourth quarter representing a significantly higher level
of cash than other periods.
Throughout the fiscal year, we utilize our cash balances to build our inventory levels in preparation for our fourth
quarter holiday sales. In fiscal 2007, we plan to utilize our cash resources to fund our inventory and inventory
related purchases, catalog advertising and marketing initiatives, purchases of property and equipment, share
repurchases and dividends. In addition to the current cash balances on-hand, we have a $300,000,000 credit
facility available as of January 28, 2007 that may be used for loans or letters of credit. No amounts were
borrowed by us under the credit facility in either fiscal 2006 or fiscal 2005. However, as of January 28, 2007,
$37,398,000 in issued but undrawn standby letters of credit was outstanding under the credit facility. We believe
our cash on-hand, in addition to our available credit facilities, will provide adequate liquidity for our business
operations and growth opportunities over the next 12 month period.
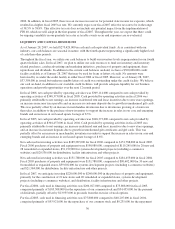
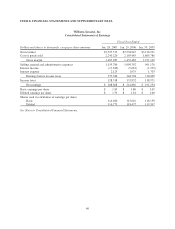
In fiscal 2006, net cash provided by operating activities was $309,114,000 compared to net cash provided by
operating activities of $348,373,000 in fiscal 2005. Cash provided by operating activities in fiscal 2006 was
primarily attributable to net earnings, an increase in deferred rent and lease incentives due to new store openings,
an increase in income taxes payable and an increase in customer deposits due to growth in unredeemed gift cards.
This was partially offset by an increase in merchandise inventories due to inventories growing at a faster rate
than sales, in addition to the purchase of new inventory to support the increase in sales in our core and emerging
brands and an increase in our leased square footage of 8.3%.
In fiscal 2005, net cash provided by operating activities was $348,373,000 compared to net cash provided by
operating activities of $304,437,000 in fiscal 2004. Cash provided by operating activities in fiscal 2005 was
primarily attributable to net earnings, an increase in deferred rent and lease incentives due to new store openings,
and an increase in customer deposits due to growth in unredeemed gift certificates and gift cards. This was
partially offset by an increase in merchandise inventories in order to support the increase in sales in our core and
emerging brands and an increase in our leased square footage of 8.6%.
Net cash used in investing activities was $189,287,000 for fiscal 2006 compared to $151,788,000 in fiscal 2005.
Fiscal 2006 purchases of property and equipment were $190,980,000, comprised of $119,245,000 for 28 new and
28 remodeled or expanded stores, $51,199,000 for systems development projects (including e-commerce
websites) and $20,536,000 for distribution, facility infrastructure and other projects.
Net cash used in investing activities was $151,788,000 for fiscal 2005 compared to $181,453,000 in fiscal 2004.
Fiscal 2005 purchases of property and equipment were $151,788,000, comprised of $90,602,000 for 30 new and
8 remodeled or expanded stores, $39,602,000 for systems development projects (including e-commerce websites)
and $21,584,000 for distribution, facility infrastructure and other projects.
In fiscal 2007, we anticipate investing $220,000,000 to $240,000,000 in the purchase of property and equipment,
primarily for the construction of 21 new stores and 20 remodeled or expanded stores, systems development
projects (including e-commerce websites), and distribution, facility infrastructure and other projects.
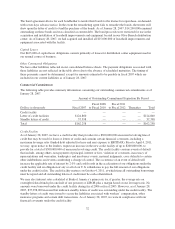
For fiscal 2006, cash used in financing activities was $206,027,000 compared to $75,808,000 in fiscal 2005,
comprised primarily of $185,508,000 for the repurchase of our common stock and $34,435,000 for the payment
of dividends, partially offset by $13,935,000 in proceeds from the exercise of stock options.
For fiscal 2005, cash used in financing activities was $75,808,000 compared to $48,207,000 in fiscal 2004,
comprised primarily of $93,921,000 for the repurchase of our common stock and $9,235,000 for the repayment
30