Pottery Barn 2006 Annual Report Download - page 134
Download and view the complete annual report
Please find page 134 of the 2006 Pottery Barn annual report below. You can navigate through the pages in the report by either clicking on the pages listed below, or by using the keyword search tool below to find specific information within the annual report.-
 1
1 -
2
-
3
-
4
-
5
-
6
-
7
-
8
-
9
-
10
-
11
-
12
-
13
-
14
-
15
-
16
-
17
-
18
-
19
-
20
-
21
-
22
-
23
-
24
-
25
-
26
-
27
-
28
-
29
-
30
-
31
-
32
-
33
-
34
-
35
-
36
-
37
-
38
-
39
-
40
-
41
-
42
-
43
-
44
-
45
-
46
-
47
-
48
-
49
-
50
-
51
-
52
-
53
-
54
-
55
-
56
-
57
-
58
-
59
-
60
-
61
-
62
-
63
-
64
-
65
-
66
-
67
-
68
-
69
-
70
-
71
-
72
-
73
-
74
-
75
-
76
-
77
-
78
-
79
-
80
-
81
-
82
-
83
-
84
-
85
-
86
-
87
-
88
-
89
-
90
-
91
-
92
-
93
-
94
-
95
-
96
-
97
-
98
-
99
-
100
-
101
-
102
-
103
-
104
-
105
-
106
-
107
-
108
-
109
-
110
-
111
-
112
-
113
-
114
-
115
-
116
-
117
-
118
-
119
-
120
-
121
-
122
-
123
-
 124
124 -
 125
125 -
 126
126 -
 127
127 -
 128
128 -
 129
129 -
 130
130 -
 131
131 -
 132
132 -
 133
133 -
 134
134 -
 135
135 -
 136
136 -
 137
137 -
 138
138 -
 139
139 -
 140
140 -
 141
141 -
 142
142 -
 143
143 -
 144
144 -
145
-
146
-
147
-
148
-
149
-
150
-
151
-
152
 |
 |
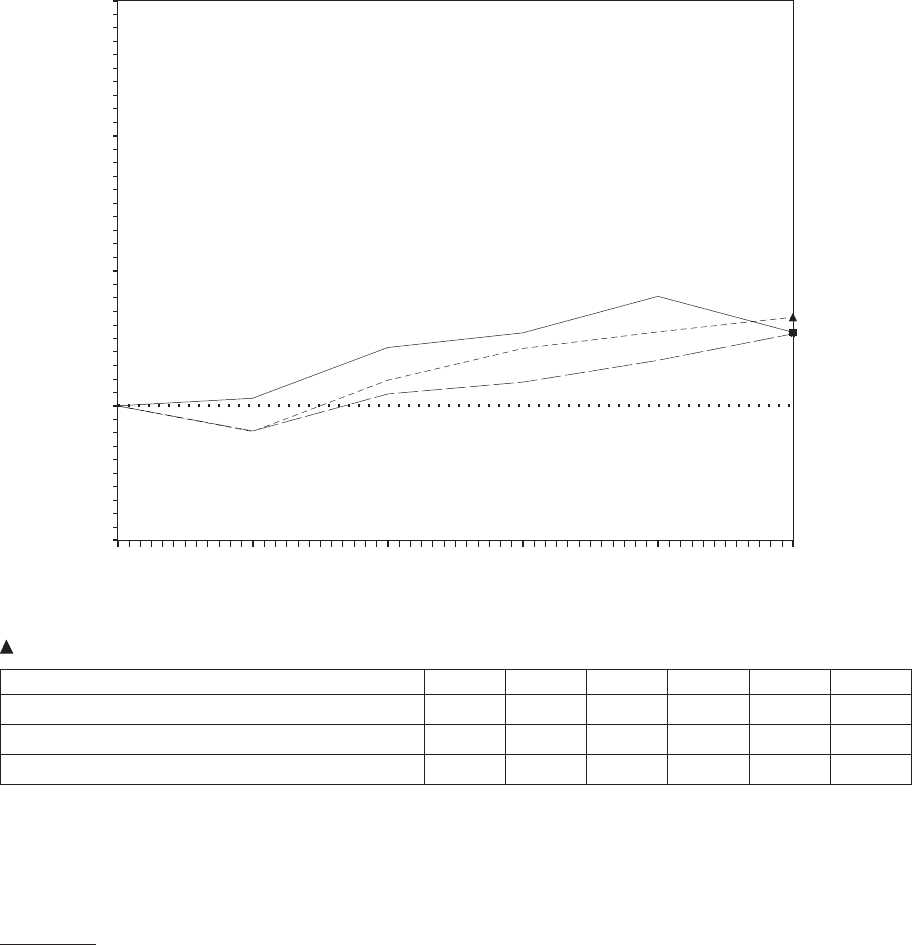
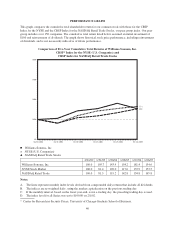
PERFORMANCE GRAPH
This graph compares the cumulative total shareholder return for our common stock with those for the CRSP
Index for the NYSE and the CRSP Index for the NASDAQ Retail Trade Stocks, our peer group index. Our peer
group includes over 150 companies. The cumulative total return listed below assumed an initial investment of
$100 and reinvestment of dividends. The graph shows historical stock price performance, including reinvestment
of dividends, and is not necessarily indicative of future performance.
Comparison of Five-Year Cumulative Total Returns of Williams-Sonoma, Inc.
CRSP* Index for the NYSE (U.S. Companies) and
CRSP Index for NASDAQ Retail Trade Stocks
01/30/200402/01/2002 01/31/2003 01/28/2005 01/27/2006 01/26/2007
153.5
154.6
165.8
$400
$300
$200
$100
$0
䡲Williams-Sonoma, Inc
★NYSE (U.S. Companies)
NASDAQ Retail Trade Stocks
2/01/02 1/31/03 1/30/04 1/28/05 1/27/06 1/26/07
Williams-Sonoma, Inc. 100.0 105.7 143.4 154.2 181.4 154.6
NYSE Stock Market 100.0 81.4 109.0 117.6 133.9 153.5
NASDAQ Retail Trade 100.0 81.3 119.2 142.8 154.8 165.8
Notes:
A. The lines represent monthly index levels derived from compounded daily returns that include all dividends.
B. The indices are re-weighted daily, using the market capitalization on the previous trading day.
C. If the monthly interval, based on the fiscal year-end, is not a trading day, the preceding trading day is used.
D. The index level for all Series was set to $100.00 on 2/1/02.
* Center for Research in Security Prices, University of Chicago Graduate School of Business.
40