Pottery Barn 2006 Annual Report Download - page 38
Download and view the complete annual report
Please find page 38 of the 2006 Pottery Barn annual report below. You can navigate through the pages in the report by either clicking on the pages listed below, or by using the keyword search tool below to find specific information within the annual report.
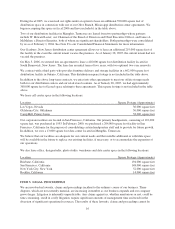
Various factors affect comparable store sales, including the number, size and location of stores we open, close,
remodel or expand in any period, the general retail sales environment, consumer preferences and buying trends,
changes in sales mix between distribution channels, our ability to efficiently source and distribute products,
changes in our merchandise mix, competition (including competitive promotional activity), current local and
global economic conditions, the timing of our releases of new merchandise and promotional events, the success
of marketing programs, the cannibalization of existing store sales by our new stores, increased catalog circulation
and continued strength in our Internet business. Among other things, weather conditions can affect comparable
store sales because inclement weather can alter consumer behavior or require us to close certain stores
temporarily and thus reduce store traffic. Even if stores are not closed, many customers may decide to avoid
going to stores in bad weather. These factors have caused our comparable store sales to fluctuate significantly in
the past on an annual, quarterly and monthly basis and, as a result, we expect that comparable store sales will
continue to fluctuate in the future.
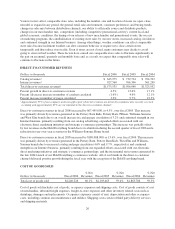
DIRECT-TO-CUSTOMER REVENUES
Dollars in thousands Fiscal 2006 Fiscal 2005 Fiscal 2004
Catalog revenues1$ 645,975 $ 739,734 $ 764,703
Internet revenues1927,560 766,306 561,249
Total direct-to-customer revenues1$1,573,535 $1,506,040 $1,325,952
Percent growth in direct-to-customer revenues 4.5% 13.6% 17.1%
Percent (decrease) increase in number of catalogs circulated (1.6%) 4.6% 12.1%
Percent increase in number of pages circulated 3.2% 9.7% 19.5%
1Approximately 55% of our company-wide non-gift registry Internet revenues are driven by customers who recently received
a catalog and approximately 45% are incremental to the direct-to-customer channel.
Direct-to-customer revenues in fiscal 2006 increased by $67,495,000, or 4.5%, over fiscal 2005. This increase
was primarily driven by revenues generated in the Pottery Barn Kids, Pottery Barn, PBteen, Williams-Sonoma
and West Elm brands due to an overall increase in catalog page circulation of 3.2% and continued strength in our
Internet business, primarily resulting from our catalog advertising, expanded efforts associated with our
electronic direct marketing initiatives and strategic e-commerce partnerships. This increase was partially offset
by lost revenues in the Hold Everything brand due to its shutdown during the second quarter of fiscal 2006 and a
reduction in year-over-year revenues in the Williams-Sonoma Home brand.
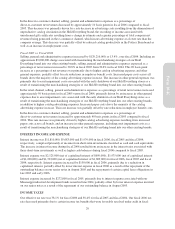
Direct-to-customer revenues in fiscal 2005 increased by $180,088,000, or 13.6%, over fiscal 2004. This increase
was primarily driven by revenues generated in the Pottery Barn, Pottery Barn Kids, West Elm and Williams-
Sonoma brands due to increased catalog and page circulation (4.6% and 9.7%, respectively) and continued
strength in our Internet business, primarily resulting from our expanded efforts associated with our electronic
direct marketing initiatives and strategic e-commerce partnerships, and the incremental net revenues generated by
the late 2004 launch of our Hold Everything e-commerce website. All of our brands in the direct-to-customer
channel delivered positive growth during the fiscal year with the exception of the Hold Everything brand.
COST OF GOODS SOLD
Dollars in thousands Fiscal 2006
% Net
Revenues Fiscal 2005
% Net
Revenues Fiscal 2004
% Net
Revenues
Total cost of goods sold $2,240,226 60.1% $2,103,465 59.4% $1,865,786 59.5%
Cost of goods sold includes cost of goods, occupancy expenses and shipping costs. Cost of goods consists of cost
of merchandise, inbound freight expenses, freight-to-store expenses and other inventory related costs such as
shrinkage, damages and replacements. Occupancy expenses consist of rent, depreciation and other occupancy
costs, including common area maintenance and utilities. Shipping costs consist of third party delivery services
and shipping materials.
26


