Panera Bread 2014 Annual Report Download - page 79
Download and view the complete annual report
Please find page 79 of the 2014 Panera Bread annual report below. You can navigate through the pages in the report by either clicking on the pages listed below, or by using the keyword search tool below to find specific information within the annual report.-
 1
1 -
2
-
3
-
4
-
5
-
6
-
7
-
8
-
9
-
10
-
11
-
12
-
13
-
14
-
15
-
16
-
17
-
18
-
19
-
20
-
21
-
22
-
23
-
24
-
25
-
26
-
27
-
28
-
29
-
30
-
31
-
32
-
33
-
34
-
35
-
36
-
37
-
38
-
39
-
40
-
41
-
42
-
43
-
44
-
45
-
46
-
47
-
48
-
49
-
50
-
51
-
52
-
53
-
54
-
55
-
56
-
57
-
58
-
59
-
60
-
61
-
62
-
63
-
64
-
65
-
66
-
67
-
68
-
 69
69 -
 70
70 -
 71
71 -
 72
72 -
 73
73 -
 74
74 -
 75
75 -
 76
76 -
 77
77 -
 78
78 -
 79
79 -
 80
80 -
 81
81 -
 82
82 -
 83
83 -
 84
84 -
 85
85 -
 86
86 -
 87
87 -
 88
88
 |
 |

PANERA BREAD COMPANY
NOTES TO THE CONSOLIDATED FINANCIAL STATEMENTS (continued)
67
“Unallocated cash and cash equivalents” relates primarily to corporate cash and cash equivalents, “unallocated trade and other
accounts receivable” relates primarily to rebates and interest receivable, “unallocated property and equipment” relates primarily
to corporate fixed assets, “unallocated deposits and other” relates primarily to insurance deposits, and “other unallocated assets”
relates primarily to deferred income taxes.
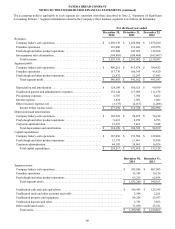
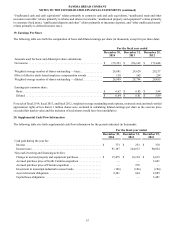
19. Earnings Per Share
The following table sets forth the computation of basic and diluted earnings per share (in thousands, except for per share data):
For the fiscal year ended
December 30,
2014
December 31,
2013
December 25,
2012
Amounts used for basic and diluted per share calculations:
Net income . . . . . . . . . . . . . . . . . . . . . . . . . . . . . . . . . . . . . . . . . . . . . . . . . . . $ 179,293 $ 196,169 $ 173,448
Weighted average number of shares outstanding — basic . . . . . . . . . . . . . . . 26,881 28,629 29,217
Effect of dilutive stock-based employee compensation awards . . . . . . . . . . . 118 165 238
Weighted average number of shares outstanding — diluted. . . . . . . . . . . . . . 26,999 28,794 29,455
Earnings per common share:
Basic . . . . . . . . . . . . . . . . . . . . . . . . . . . . . . . . . . . . . . . . . . . . . . . . . . . . . . . $ 6.67 $ 6.85 $ 5.94
Diluted . . . . . . . . . . . . . . . . . . . . . . . . . . . . . . . . . . . . . . . . . . . . . . . . . . . . . $ 6.64 $ 6.81 $ 5.89
For each of fiscal 2014, fiscal 2013, and fiscal 2012, weighted-average outstanding stock options, restricted stock and stock-settled
appreciation rights of less than 0.1 million shares were excluded in calculating diluted earnings per share as the exercise price
exceeded fair market value and the inclusion of such shares would have been antidilutive.
20. Supplemental Cash Flow Information
The following table sets forth supplemental cash flow information for the periods indicated (in thousands):
For the fiscal year ended
December 30,
2014
December 31,
2013
December 25,
2012
Cash paid during the year for:
Interest . . . . . . . . . . . . . . . . . . . . . . . . . . . . . . . . . . . . . . . . . . . . . . . . . . . . . $ 773 $ 253 $ 370
Income taxes . . . . . . . . . . . . . . . . . . . . . . . . . . . . . . . . . . . . . . . . . . . . . . . . 91,187 104,072 90,054
Non-cash investing and financing activities:
Change in accrued property and equipment purchases . . . . . . . . . . . . . . . . $ 15,479 $ 16,194 $ 6,019
Accrued purchase price of North Carolina acquisition . . . . . . . . . . . . . . . . — — 3,601
Accrued purchase price of Florida acquisition . . . . . . . . . . . . . . . . . . . . . . — 270 —
Investment in municipal industrial revenue bonds . . . . . . . . . . . . . . . . . . . (186)(186)(186)
Asset retirement obligations . . . . . . . . . . . . . . . . . . . . . . . . . . . . . . . . . . . . 9,341 664 2,885
Capital lease obligations . . . . . . . . . . . . . . . . . . . . . . . . . . . . . . . . . . . . . . . — — 3,481