Panera Bread 2014 Annual Report Download - page 33
Download and view the complete annual report
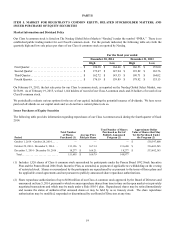
Please find page 33 of the 2014 Panera Bread annual report below. You can navigate through the pages in the report by either clicking on the pages listed below, or by using the keyword search tool below to find specific information within the annual report.-
 1
1 -
2
-
3
-
4
-
5
-
6
-
7
-
8
-
9
-
10
-
11
-
12
-
13
-
14
-
15
-
16
-
17
-
18
-
19
-
20
-
21
-
22
-
 23
23 -
 24
24 -
 25
25 -
 26
26 -
 27
27 -
 28
28 -
 29
29 -
 30
30 -
 31
31 -
 32
32 -
 33
33 -
 34
34 -
 35
35 -
 36
36 -
 37
37 -
 38
38 -
 39
39 -
 40
40 -
 41
41 -
 42
42 -
 43
43 -
44
-
45
-
46
-
47
-
48
-
49
-
50
-
51
-
52
-
53
-
54
-
55
-
56
-
57
-
58
-
59
-
60
-
61
-
62
-
63
-
64
-
65
-
66
-
67
-
68
-
69
-
70
-
71
-
72
-
73
-
74
-
75
-
76
-
77
-
78
-
79
-
80
-
81
-
82
-
83
-
84
-
85
-
86
-
87
-
88
 |
 |

21
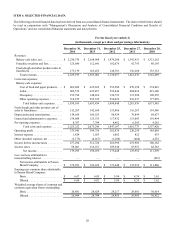
For the fiscal year ended (1)
(in thousands, except per share and percentage information)
December 30,
2014
December 31,
2013
December 25,
2012
December 27,
2011
December 28,
2010
Consolidated balance sheet data:
Cash and cash equivalents . . . . . . . . . . . $ 196,493 $ 125,245 $ 297,141 $ 222,640 $ 229,299
Prepaid expenses and other . . . . . . . . . . 51,588 43,064 42,223 31,228 23,905
Property and equipment, net . . . . . . . . . 787,294 669,409 571,754 492,022 444,094
Total assets. . . . . . . . . . . . . . . . . . . . . . . 1,390,902 1,180,862 1,268,163 1,027,322 924,581
Current liabilities . . . . . . . . . . . . . . . . . . 352,712 303,325 277,540 238,334 211,516
Long-term liabilities . . . . . . . . . . . . . . . 302,006 177,645 168,704 133,912 117,457
Stockholders’ equity . . . . . . . . . . . . . . . 736,184 699,892 821,919 655,076 595,608
Franchisee revenues (2) . . . . . . . . . . . . . . $ 2,281,755 $ 2,175,155 $ 1,981,674 $ 1,828,188 $ 1,802,116
Comparable net bakery-cafe sales
percentage for (2)(3):
Company-owned bakery-cafes . . . . . . . 1.4% 2.6% 6.5% 4.9% 7.5%
Franchise-operated bakery-cafes . . . . . . 0.9% 2.0% 5.0% 3.4% 8.2%
Bakery-cafe data:
Company-owned bakery-cafes open . . . 925 867 809 740 662
Franchise-operated bakery-cafes open . 955 910 843 801 791
Total bakery-cafes open . . . . . . . . . . . 1,880 1,777 1,652 1,541 1,453
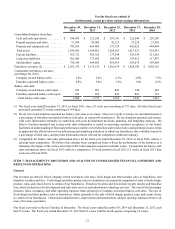
(1) The fiscal year ended December 31, 2013, or fiscal 2013, was a 53 week year consisting of 371 days. All other fiscal years
presented contained 52 weeks consisting of 364 days.
(2) We do not record franchise-operated net bakery-cafe sales as revenues. However, royalty revenues are calculated based on
a percentage of franchise-operated net bakery-cafe sales, as reported by franchisees. We use franchise-operated and system-
wide sales information internally in connection with store development decisions, planning, and budgeting analyses. We
believe franchise-operated and system-wide sales information is useful in assessing consumer acceptance of our brand,
facilitates an understanding of financial performance and the overall direction and trends of sales and operating income, helps
us appreciate the effectiveness of our advertising and marketing initiatives to which our franchisees also contribute based on
a percentage of their sales, and provides information that is relevant for comparison within the industry.
(3) Comparable net bakery-cafe sales information above for the fiscal year ended December 30, 2014, or fiscal 2014, reflects a
calendar basis comparison. We believe this calendar basis comparison better reflects the performance of the business as it
eliminates the impact of the extra week in fiscal 2013 and compares consistent calendar weeks. Comparable net bakery-cafe
sales information above for fiscal 2013 reflects a comparative 53 week period in fiscal 2012 (52 weeks in fiscal 2012 plus
week one of fiscal 2013).
ITEM 7. MANAGEMENT’S DISCUSSION AND ANALYSIS OF CONSOLIDATED FINANCIAL CONDITION AND
RESULTS OF OPERATIONS
General
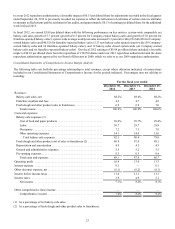
Our revenues are derived from Company-owned net bakery-cafe sales, fresh dough and other product sales to franchisees, and
franchise royalties and fees. Fresh dough and other product sales to franchisees are primarily comprised of sales of fresh dough,
produce, tuna, and cream cheese to certain of our franchisees. Franchise royalties and fees include royalty income and franchise
fees, which include fees for development and real estate services and information technology services. The cost of food and paper
products, labor, occupancy, and other operating expenses relate primarily to Company-owned net bakery-cafe sales. The cost of
fresh dough and other product sales to franchisees relates primarily to the sale of fresh dough, produce, tuna, and cream cheese
to certain of our franchisees. General and administrative, depreciation and amortization, and pre-opening expenses relate to all
areas of revenue generation.
Our fiscal year ends on the last Tuesday in December. The fiscal years ended December 30, 2014 and December 25, 2012 each
had 52 weeks. The fiscal year ended December 31, 2013 had 53 weeks with the fourth quarter comprising 14 weeks.