Panera Bread 2014 Annual Report Download - page 55
Download and view the complete annual report
Please find page 55 of the 2014 Panera Bread annual report below. You can navigate through the pages in the report by either clicking on the pages listed below, or by using the keyword search tool below to find specific information within the annual report.-
 1
1 -
2
-
3
-
4
-
5
-
6
-
7
-
8
-
9
-
10
-
11
-
12
-
13
-
14
-
15
-
16
-
17
-
18
-
19
-
20
-
21
-
22
-
23
-
24
-
25
-
26
-
27
-
28
-
29
-
30
-
31
-
32
-
33
-
34
-
35
-
36
-
37
-
38
-
39
-
40
-
41
-
42
-
43
-
44
-
 45
45 -
 46
46 -
 47
47 -
 48
48 -
 49
49 -
 50
50 -
 51
51 -
 52
52 -
 53
53 -
 54
54 -
 55
55 -
 56
56 -
 57
57 -
 58
58 -
 59
59 -
 60
60 -
 61
61 -
 62
62 -
 63
63 -
 64
64 -
 65
65 -
66
-
67
-
68
-
69
-
70
-
71
-
72
-
73
-
74
-
75
-
76
-
77
-
78
-
79
-
80
-
81
-
82
-
83
-
84
-
85
-
86
-
87
-
88
 |
 |

43
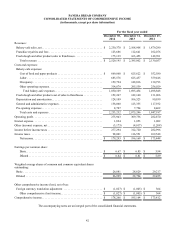
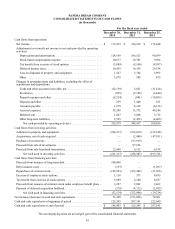
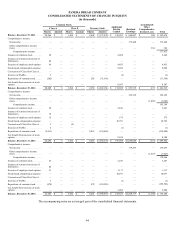
PANERA BREAD COMPANY
CONSOLIDATED STATEMENTS OF CASH FLOWS
(in thousands)
For the fiscal year ended
December 30,
2014
December 31,
2013
December 25,
2012
Cash flows from operations:
Net income . . . . . . . . . . . . . . . . . . . . . . . . . . . . . . . . . . . . . . . . . . . . . . . . . . $ 179,293 $ 196,169 $ 173,448
Adjustments to reconcile net income to net cash provided by operating
activities:
Depreciation and amortization. . . . . . . . . . . . . . . . . . . . . . . . . . . . . . . . . 124,109 106,523 90,939
Stock-based compensation expense. . . . . . . . . . . . . . . . . . . . . . . . . . . . . 10,077 10,703 9,094
Tax benefit from exercise of stock options . . . . . . . . . . . . . . . . . . . . . . . (3,089)(8,100)(8,587)
Deferred income taxes . . . . . . . . . . . . . . . . . . . . . . . . . . . . . . . . . . . . . . . 10,459 10,356 20,334
Loss on disposals of property and equipment . . . . . . . . . . . . . . . . . . . . . 1,547 5,764 3,995
Other . . . . . . . . . . . . . . . . . . . . . . . . . . . . . . . . . . . . . . . . . . . . . . . . . . . . 3,070 589 475
Changes in operating assets and liabilities, excluding the effect of
acquisitions and dispositions:
Trade and other accounts receivable, net. . . . . . . . . . . . . . . . . . . . . . . . . (22,139) 3,021 (31,414)
Inventories . . . . . . . . . . . . . . . . . . . . . . . . . . . . . . . . . . . . . . . . . . . . . . . . (895)(2,186)(2,440)
Prepaid expenses and other . . . . . . . . . . . . . . . . . . . . . . . . . . . . . . . . . . . (8,524)(841)(10,995)
Deposits and other . . . . . . . . . . . . . . . . . . . . . . . . . . . . . . . . . . . . . . . . . . 239 1,449 161
Accounts payable. . . . . . . . . . . . . . . . . . . . . . . . . . . . . . . . . . . . . . . . . . . 1,978 8,162 (6,513)
Accrued expenses. . . . . . . . . . . . . . . . . . . . . . . . . . . . . . . . . . . . . . . . . . . 35,288 13,372 49,246
Deferred rent . . . . . . . . . . . . . . . . . . . . . . . . . . . . . . . . . . . . . . . . . . . . . . 1,067 5,868 5,718
Other long-term liabilities . . . . . . . . . . . . . . . . . . . . . . . . . . . . . . . . . . . . 2,599 (2,432)(4,005)
Net cash provided by operating activities . . . . . . . . . . . . . . . . . . . . . . 335,079 348,417 289,456
Cash flows from investing activities:
Additions to property and equipment . . . . . . . . . . . . . . . . . . . . . . . . . . . . . . (224,217)(192,010)(152,328)
Acquisitions, net of cash acquired . . . . . . . . . . . . . . . . . . . . . . . . . . . . . . . . —(2,446)(47,951)
Purchase of investments . . . . . . . . . . . . . . . . . . . . . . . . . . . . . . . . . . . . . . . . —(97,919)—
Proceeds from sale of investments . . . . . . . . . . . . . . . . . . . . . . . . . . . . . . . . — 97,936 —
Proceeds from sale-leaseback transactions. . . . . . . . . . . . . . . . . . . . . . . . . . 12,900 6,132 4,538
Net cash used in investing activities . . . . . . . . . . . . . . . . . . . . . . . . . . (211,317)(188,307)(195,741)
Cash flows from financing activities:
Proceeds from issuance of long-term debt . . . . . . . . . . . . . . . . . . . . . . . . . . 100,000 — —
Debt issuance costs. . . . . . . . . . . . . . . . . . . . . . . . . . . . . . . . . . . . . . . . . . . . (193)—
(1,097)
Repurchase of common stock. . . . . . . . . . . . . . . . . . . . . . . . . . . . . . . . . . . . (159,503)(339,409)(31,566)
Exercise of employee stock options . . . . . . . . . . . . . . . . . . . . . . . . . . . . . . . 1,116 573 4,455
Tax benefit from exercise of stock options. . . . . . . . . . . . . . . . . . . . . . . . . . 3,089 8,100 8,587
Proceeds from issuance of common stock under employee benefit plans . . 3,247 2,842 2,462
Payment of deferred acquisition holdback . . . . . . . . . . . . . . . . . . . . . . . . . . (270)(4,112)(2,055)
Net cash used in financing activities. . . . . . . . . . . . . . . . . . . . . . . . . . (52,514)(332,006)(19,214)
Net increase (decrease) in cash and cash equivalents . . . . . . . . . . . . . . . . . . . 71,248 (171,896) 74,501
Cash and cash equivalents at beginning of period . . . . . . . . . . . . . . . . . . . . . 125,245 297,141 222,640
Cash and cash equivalents at end of period . . . . . . . . . . . . . . . . . . . . . . . . . . $ 196,493 $ 125,245 $ 297,141
The accompanying notes are an integral part of the consolidated financial statements.