Panera Bread 2014 Annual Report Download - page 38
Download and view the complete annual report
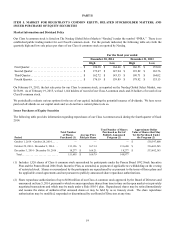
Please find page 38 of the 2014 Panera Bread annual report below. You can navigate through the pages in the report by either clicking on the pages listed below, or by using the keyword search tool below to find specific information within the annual report.-
 1
1 -
2
-
3
-
4
-
5
-
6
-
7
-
8
-
9
-
10
-
11
-
12
-
13
-
14
-
15
-
16
-
17
-
18
-
19
-
20
-
21
-
22
-
23
-
24
-
25
-
26
-
27
-
 28
28 -
 29
29 -
 30
30 -
 31
31 -
 32
32 -
 33
33 -
 34
34 -
 35
35 -
 36
36 -
 37
37 -
 38
38 -
 39
39 -
 40
40 -
 41
41 -
 42
42 -
 43
43 -
 44
44 -
 45
45 -
 46
46 -
 47
47 -
 48
48 -
49
-
50
-
51
-
52
-
53
-
54
-
55
-
56
-
57
-
58
-
59
-
60
-
61
-
62
-
63
-
64
-
65
-
66
-
67
-
68
-
69
-
70
-
71
-
72
-
73
-
74
-
75
-
76
-
77
-
78
-
79
-
80
-
81
-
82
-
83
-
84
-
85
-
86
-
87
-
88
 |
 |

26
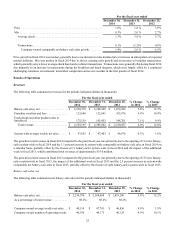
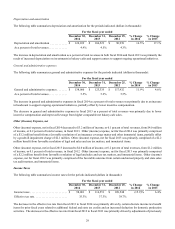
The increase in net bakery-cafe sales in fiscal 2014 compared to the prior fiscal year was primarily due to the opening of 65 new
Company-owned bakery-cafes and the 1.4 percent increase in comparable Company-owned net bakery-cafe sales in fiscal 2014
on a calendar basis, partially offset by the closure of seven Company-owned bakery-cafes and the impact of the additional week
in fiscal 2013, which contributed net bakery-cafes sales of approximately $29.8 million.
The increase in net bakery-cafe sales in fiscal 2013 compared to the prior fiscal year was primarily due to the opening of 63 new
Company-owned bakery-cafes, the impact of the additional week in fiscal 2013, and the 2.6 percent increase in comparable
Company-owned net bakery-cafe sales in fiscal 2013, partially offset by the closure of six Company-owned bakery-cafes.
The increase in average weekly net sales for Company-owned bakery-cafes in fiscal 2014 compared to the prior fiscal year was
primarily due to average check growth that resulted from retail price increases and our category management initiatives, partially
offset by lower average weekly sales in fiscal 2014 for bakery-cafes opened in fiscal 2013.
The increase in average weekly net sales for Company-owned bakery-cafes in fiscal 2013 compared to the prior fiscal year was
primarily due to average check growth that resulted from retail price increases and our category management initiatives.
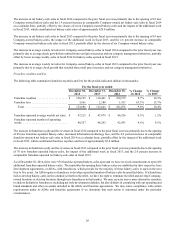
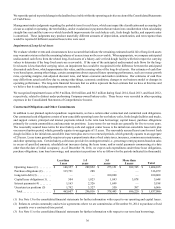
Franchise royalties and fees
The following table summarizes franchise royalties and fees for the periods indicated (dollars in thousands):
For the fiscal year ended
December 30,
2014
December 31,
2013
December 25,
2012
% Change
in 2014
% Change
in 2013
Franchise royalties . . . . . . . . . . . . . . . . . . . . . $ 120,125 $ 110,461 $ 100,159 8.7% 10.3%
Franchise fees . . . . . . . . . . . . . . . . . . . . . . . . . 3,561 2,180 1,917 63.3% 13.7%
Total . . . . . . . . . . . . . . . . . . . . . . . . . . . . . . $ 123,686 $ 112,641 $ 102,076 9.8% 10.4%
Franchise-operated average weekly net sales .$ 47,215 $ 47,079 $ 46,526 0.3% 1.2%
Franchise-operated number of operating
weeks. . . . . . . . . . . . . . . . . . . . . . . . . . . . . . . . 48,327 46,202 42,593 4.6% 8.5%
The increase in franchise royalty and fee revenues in fiscal 2014 compared to the prior fiscal year was primarily due to the opening
of 49 new franchise-operated bakery-cafes, increased information technology fees, and the 0.9 percent increase in comparable
franchise-operated net bakery-cafe sales in fiscal 2014 on a calendar basis, partially offset by the impact of the additional week
in fiscal 2013, which contributed franchise royalties and fees of approximately $2.4 million.
The increase in franchise royalty and fee revenues in fiscal 2013 compared to the prior fiscal year was primarily due to the opening
of 70 new franchise-operated bakery-cafes, the impact of the additional week in fiscal 2013, and the 2.0 percent increase in
comparable franchise-operated net bakery-cafe sales in fiscal 2013.
As of December 30, 2014, there were 955 franchise-operated bakery-cafes open and we have received commitments to open 106
additional franchise-operated bakery-cafes. The timetables for opening these bakery-cafes are established in their respective Area
Development Agreements, or ADAs, with franchisees, which provide for the majority of these bakery-cafes to open in the next
four to five years. An ADA requires a franchisee to develop a specified number of bakery-cafes by specified dates. If a franchisee
fails to develop bakery-cafes on the schedule set forth in the ADA, we have the right to terminate the ADA and develop Company-
owned locations or develop locations through new franchisees in that market. We may exercise one or more alternative remedies
to address defaults by franchisees, including not only development defaults, but also defaults in complying with our operating and
brand standards and other covenants included in the ADAs and franchise agreements. We may waive compliance with certain
requirements under its ADAs and franchise agreements if we determine that such action is warranted under the particular
circumstances.