Panera Bread 2014 Annual Report Download - page 39
Download and view the complete annual report
Please find page 39 of the 2014 Panera Bread annual report below. You can navigate through the pages in the report by either clicking on the pages listed below, or by using the keyword search tool below to find specific information within the annual report.-
 1
1 -
2
-
3
-
4
-
5
-
6
-
7
-
8
-
9
-
10
-
11
-
12
-
13
-
14
-
15
-
16
-
17
-
18
-
19
-
20
-
21
-
22
-
23
-
24
-
25
-
26
-
27
-
28
-
 29
29 -
 30
30 -
 31
31 -
 32
32 -
 33
33 -
 34
34 -
 35
35 -
 36
36 -
 37
37 -
 38
38 -
 39
39 -
 40
40 -
 41
41 -
 42
42 -
 43
43 -
 44
44 -
 45
45 -
 46
46 -
 47
47 -
 48
48 -
 49
49 -
50
-
51
-
52
-
53
-
54
-
55
-
56
-
57
-
58
-
59
-
60
-
61
-
62
-
63
-
64
-
65
-
66
-
67
-
68
-
69
-
70
-
71
-
72
-
73
-
74
-
75
-
76
-
77
-
78
-
79
-
80
-
81
-
82
-
83
-
84
-
85
-
86
-
87
-
88
 |
 |

27
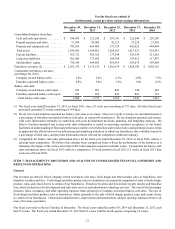
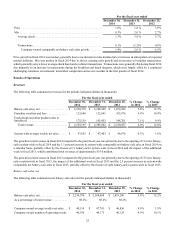
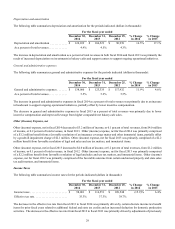
Fresh dough and other product sales to franchisees
The following table summarizes fresh dough and other product sales to franchisees for the periods indicated (dollars in thousands):
For the fiscal year ended
December 30,
2014
December 31,
2013
December 25,
2012
% Change
in 2014
% Change
in 2013
Fresh dough and other product sales to
franchisees. . . . . . . . . . . . . . . . . . . . . . . . . . . . $ 175,139 $ 163,453 $ 148,701 7.1% 9.9%
The increase in fresh dough and other product sales to franchisees in fiscal 2014 compared to the prior fiscal year was primarily
due to the opening of 49 franchise-operated bakery-cafes and the 0.9 percent increase in franchise-operated comparable net bakery-
cafe sales on a calendar basis, partially offset by the impact of the additional week in fiscal 2013, which contributed fresh dough
and other product sales to franchisees of approximately $2.8 million.
The increase in fresh dough and other product sales to franchisees in fiscal 2013 compared to the prior fiscal year was primarily
due to the impact of the additional week in fiscal 2013, the opening of 70 franchise-operated bakery-cafes, and the 2.0 percent
increase in franchise-operated comparable net bakery-cafe sales.
Costs and Expenses
The cost of food and paper products includes the costs associated with the fresh dough and other product operations that sell fresh
dough and other products to Company-owned bakery-cafes, as well as the cost of food and paper products supplied by third-party
vendors and distributors. The costs associated with the fresh dough and other product operations that sell fresh dough and other
products to the franchise-operated bakery-cafes are excluded from the cost of food and paper products and are shown separately
as fresh dough and other product cost of sales to franchisees in the Consolidated Statements of Comprehensive Income.
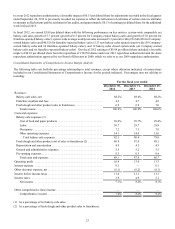
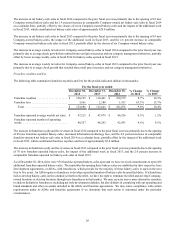
Cost of food and paper products
The following table summarizes cost of food and paper products for the periods indicated (dollars in thousands):
For the fiscal year ended
December 30,
2014
December 31,
2013
December 25,
2012
% Change
in 2014
% Change
in 2013
Cost of food and paper products . . . . . . . . . . . $ 669,860 $ 625,622 $ 552,580 7.1% 13.2%
As a percent of bakery-cafe sales, net. . . . . . . 30.0% 29.7% 29.4%
The increase in the cost of food and paper products in fiscal 2014 as a percentage of net bakery-cafe sales was primarily due to
higher ingredient costs, including, but not limited to, increases in the costs of butter, avocados, and bacon, partially offset by
improved leverage of our fresh dough manufacturing costs due to additional bakery-cafe openings. In fiscal 2014, there was an
average of 79.2 bakery-cafes per fresh dough facility compared to an average of 74.2 bakery-cafes in fiscal 2013.
The increase in the cost of food and paper products in fiscal 2013 as a percentage of net bakery-cafe sales was primarily due to a
shift in product mix towards higher ingredient cost products, partially offset by improved leverage of our fresh dough manufacturing
costs due to additional bakery-cafe openings. In fiscal 2013, there was an average of 74.2 bakery-cafes per fresh dough facility
compared to an average of 69.2 bakery-cafes in fiscal 2012.
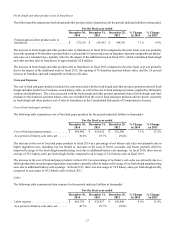
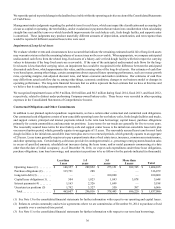
Labor
The following table summarizes labor expense for the periods indicated (dollars in thousands):
For the fiscal year ended
December 30,
2014
December 31,
2013
December 25,
2012
% Change
in 2014
% Change
in 2013
Labor expense . . . . . . . . . . . . . . . . . . . . . . . . . $ 685,576 $ 625,457 $ 559,446 9.6% 11.8%
As a percent of bakery-cafe sales, net. . . . . . . 30.7% 29.7% 29.8%