Panera Bread 2014 Annual Report Download - page 36
Download and view the complete annual report
Please find page 36 of the 2014 Panera Bread annual report below. You can navigate through the pages in the report by either clicking on the pages listed below, or by using the keyword search tool below to find specific information within the annual report.-
 1
1 -
2
-
3
-
4
-
5
-
6
-
7
-
8
-
9
-
10
-
11
-
12
-
13
-
14
-
15
-
16
-
17
-
18
-
19
-
20
-
21
-
22
-
23
-
24
-
25
-
 26
26 -
 27
27 -
 28
28 -
 29
29 -
 30
30 -
 31
31 -
 32
32 -
 33
33 -
 34
34 -
 35
35 -
 36
36 -
 37
37 -
 38
38 -
 39
39 -
 40
40 -
 41
41 -
 42
42 -
 43
43 -
 44
44 -
 45
45 -
 46
46 -
47
-
48
-
49
-
50
-
51
-
52
-
53
-
54
-
55
-
56
-
57
-
58
-
59
-
60
-
61
-
62
-
63
-
64
-
65
-
66
-
67
-
68
-
69
-
70
-
71
-
72
-
73
-
74
-
75
-
76
-
77
-
78
-
79
-
80
-
81
-
82
-
83
-
84
-
85
-
86
-
87
-
88
 |
 |

24
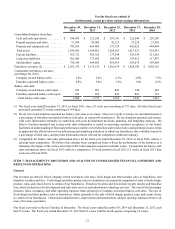
Bakery-cafe Composition
The following table sets forth certain bakery-cafe data relating to Company-owned and franchise-operated bakery-cafes for the
periods indicated:
For the fiscal year ended
December 30,
2014
December 31,
2013
December 25,
2012
Number of bakery-cafes:
Company-owned:
Beginning of period . . . . . . . . . . . . . . . . . . . . . . . . . . . . . . . . . . . . . . . . . 867 809 740
Bakery-cafes opened . . . . . . . . . . . . . . . . . . . . . . . . . . . . . . . . . . . . . . . . 65 63 59
Bakery-cafes closed . . . . . . . . . . . . . . . . . . . . . . . . . . . . . . . . . . . . . . . . . (7)(6)(6)
Bakery-cafes acquired from franchisees (1) . . . . . . . . . . . . . . . . . . . . . . — 1 16
End of period. . . . . . . . . . . . . . . . . . . . . . . . . . . . . . . . . . . . . . . . . . . . 925 867 809
Franchise-operated:
Beginning of period . . . . . . . . . . . . . . . . . . . . . . . . . . . . . . . . . . . . . . . . . 910 843 801
Bakery-cafes opened . . . . . . . . . . . . . . . . . . . . . . . . . . . . . . . . . . . . . . . . 49 70 64
Bakery-cafes closed . . . . . . . . . . . . . . . . . . . . . . . . . . . . . . . . . . . . . . . . . (4)(2)(6)
Bakery-cafes acquired by Company (1) . . . . . . . . . . . . . . . . . . . . . . . . . — (1)(16)
End of period. . . . . . . . . . . . . . . . . . . . . . . . . . . . . . . . . . . . . . . . . . . . 955 910 843
System-wide:
Beginning of period . . . . . . . . . . . . . . . . . . . . . . . . . . . . . . . . . . . . . . . . . 1,777 1,652 1,541
Bakery-cafes opened . . . . . . . . . . . . . . . . . . . . . . . . . . . . . . . . . . . . . . . . 114 133 123
Bakery-cafes closed . . . . . . . . . . . . . . . . . . . . . . . . . . . . . . . . . . . . . . . . . (11)(8)(12)
End of period (2) . . . . . . . . . . . . . . . . . . . . . . . . . . . . . . . . . . . . . . . . . 1,880 1,777 1,652
(1) In April 2013, we acquired one bakery-cafe from a Florida franchisee. In March 2012, we acquired 16 bakery-cafes from a
North Carolina franchisee.
(2) Excluded from the number of total bakery-cafes were 22, six, and three catering-only units, referred to as delivery hubs, as
of the fiscal years ended December 30, 2014, December 31, 2013, December 25, 2012, respectively.
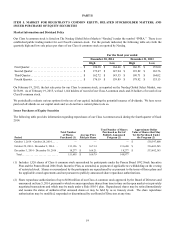
Comparable Net Bakery-cafe Sales
Comparable net bakery-cafe sales growth for the fiscal periods indicated was as follows:
For the fiscal year ended
December 30,
2014 (1)
December 31,
2013 (2)
December 25,
2012
Company-owned . . . . . . . . . . . . . . . . . . . . . . . . . . . . . . . . . . . . . . . . . . . . . . 1.4% 2.6% 6.5%
Franchise-operated . . . . . . . . . . . . . . . . . . . . . . . . . . . . . . . . . . . . . . . . . . . . . 0.9% 2.0% 5.0%
System-wide . . . . . . . . . . . . . . . . . . . . . . . . . . . . . . . . . . . . . . . . . . . . . . . . . . 1.1% 2.3% 5.7%
(1) Comparable net bakery-cafe sales for fiscal 2014 reflects a calendar basis comparison. We believe that calendar basis comparable
net bakery-cafe sales percentages better reflects the performance of the business as it eliminates the impact of the extra week
in fiscal 2013 and compares consistent calendar weeks.
(2) Comparable net bakery-cafe sales for fiscal 2013 adjusted to reflect a comparative 53 week period in fiscal 2012 (52 weeks
in fiscal 2012 plus week one of fiscal 2013).
The following table summarizes the composition of comparable Company-owned net bakery-cafe sales growth for the periods
indicated: