Panera Bread 2014 Annual Report Download - page 41
Download and view the complete annual report
Please find page 41 of the 2014 Panera Bread annual report below. You can navigate through the pages in the report by either clicking on the pages listed below, or by using the keyword search tool below to find specific information within the annual report.-
 1
1 -
2
-
3
-
4
-
5
-
6
-
7
-
8
-
9
-
10
-
11
-
12
-
13
-
14
-
15
-
16
-
17
-
18
-
19
-
20
-
21
-
22
-
23
-
24
-
25
-
26
-
27
-
28
-
29
-
30
-
 31
31 -
 32
32 -
 33
33 -
 34
34 -
 35
35 -
 36
36 -
 37
37 -
 38
38 -
 39
39 -
 40
40 -
 41
41 -
 42
42 -
 43
43 -
 44
44 -
 45
45 -
 46
46 -
 47
47 -
 48
48 -
 49
49 -
 50
50 -
 51
51 -
52
-
53
-
54
-
55
-
56
-
57
-
58
-
59
-
60
-
61
-
62
-
63
-
64
-
65
-
66
-
67
-
68
-
69
-
70
-
71
-
72
-
73
-
74
-
75
-
76
-
77
-
78
-
79
-
80
-
81
-
82
-
83
-
84
-
85
-
86
-
87
-
88
 |
 |

29
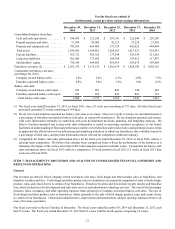
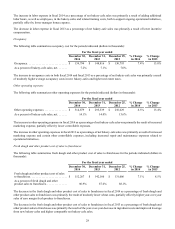
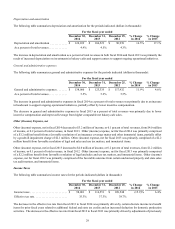
Depreciation and amortization
The following table summarizes depreciation and amortization for the periods indicated (dollars in thousands):
For the fiscal year ended
December 30,
2014
December 31,
2013
December 25,
2012
% Change
in 2014
% Change
in 2013
Depreciation and amortization . . . . . . . . . . . . $ 124,109 $ 106,523 $ 90,939 16.5% 17.1%
As a percent of total revenues . . . . . . . . . . . . . 4.9% 4.5% 4.3%
The increase in depreciation and amortization as a percent of total revenues in both fiscal 2014 and fiscal 2013 was primarily the
result of increased depreciation on investments in bakery-cafes and support centers to support ongoing operational initiatives.
General and administrative expenses
The following table summarizes general and administrative expenses for the periods indicated (dollars in thousands):
For the fiscal year ended
December 30,
2014
December 31,
2013
December 25,
2012
% Change
in 2014
% Change
in 2013
General and administrative expenses . . . . . . . $ 138,060 $ 123,335 $ 117,932 11.9% 4.6%
As a percent of total revenues . . . . . . . . . . . . . 5.5% 5.2% 5.5%
The increase in general and administrative expenses in fiscal 2014 as a percent of total revenues was primarily due to an increase
in headcount to support ongoing operational initiatives, partially offset by lower incentive compensation.
The decrease in general and administrative expenses in fiscal 2013 as a percent of total revenues was primarily due to lower
incentive compensation and improved leverage from higher comparable net bakery-cafe sales.
Other (Income) Expense, net
Other (income) expense, net in fiscal 2014 decreased to $3.2 million of income, or 0.1 percent of total revenues, from $4.0 million
of income, or 0.2 percent of total revenues, in fiscal 2013. Other (income) expense, net for fiscal 2014 was primarily comprised
of a $3.2 million benefit from a favorable resolution of an insurance coverage matter and other immaterial items, partially offset
by a goodwill impairment charge of $2.1 million. Other (income) expense, net for fiscal 2013 was primarily comprised of a $2.2
million benefit from favorable resolution of legal and sales and use tax matters, and immaterial items.
Other (income) expense, net in fiscal 2013 increased to $4.0 million of income, or 0.2 percent of total revenues, from $1.2 million
of income, or 0.1 percent of total revenues, in fiscal 2012. Other (income) expense, net for fiscal 2013 was primarily comprised
of a $2.2 million benefit from favorable resolution of legal and sales and use tax matters, and immaterial items. Other (income)
expense, net for fiscal 2012 was primarily comprised of the favorable outcome from certain unclaimed property and state sales
tax audit matters, and immaterial items.
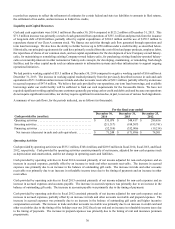
Income Taxes
The following table summarizes income taxes for the periods indicated (dollars in thousands):
For the fiscal year ended
December 30,
2014
December 31,
2013
December 25,
2012
% Change
in 2014
% Change
in 2013
Income taxes . . . . . . . . . . . . . . . . . . . . . . . . . . $ 98,001 $ 116,551 $ 109,548 (15.9)% 6.4%
Effective tax rate . . . . . . . . . . . . . . . . . . . . . . . 35.3% 37.3% 38.7%
The decrease in the effective tax rate from fiscal 2013 to fiscal 2014 was primarily driven by certain discrete income tax benefit
items for prior fiscal years related to additional federal and state tax credits and an increased deduction for domestic production
activities. The decrease in the effective tax rate from fiscal 2012 to fiscal 2013 was primarily driven by adjustments of previously