Panera Bread 2014 Annual Report Download - page 65
Download and view the complete annual report
Please find page 65 of the 2014 Panera Bread annual report below. You can navigate through the pages in the report by either clicking on the pages listed below, or by using the keyword search tool below to find specific information within the annual report.-
 1
1 -
2
-
3
-
4
-
5
-
6
-
7
-
8
-
9
-
10
-
11
-
12
-
13
-
14
-
15
-
16
-
17
-
18
-
19
-
20
-
21
-
22
-
23
-
24
-
25
-
26
-
27
-
28
-
29
-
30
-
31
-
32
-
33
-
34
-
35
-
36
-
37
-
38
-
39
-
40
-
41
-
42
-
43
-
44
-
45
-
46
-
47
-
48
-
49
-
50
-
51
-
52
-
53
-
54
-
 55
55 -
 56
56 -
 57
57 -
 58
58 -
 59
59 -
 60
60 -
 61
61 -
 62
62 -
 63
63 -
 64
64 -
 65
65 -
 66
66 -
 67
67 -
 68
68 -
 69
69 -
 70
70 -
 71
71 -
 72
72 -
 73
73 -
 74
74 -
 75
75 -
76
-
77
-
78
-
79
-
80
-
81
-
82
-
83
-
84
-
85
-
86
-
87
-
88
 |
 |

PANERA BREAD COMPANY
NOTES TO THE CONSOLIDATED FINANCIAL STATEMENTS (continued)
53
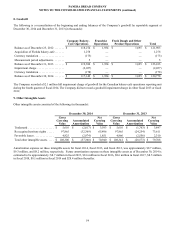
Goodwill recorded in connection with this acquisition was attributable to the workforce of the acquired bakery-cafes and synergies
expected to arise from cost savings opportunities. All of the recorded goodwill is tax deductible and is included in the Company
Bakery-Cafe Operations segment.
Accrued Purchase Price Payments
During fiscal 2014, fiscal 2013, and fiscal 2012, the Company paid approximately $0.3 million, $4.1 million, and $2.1 million,
respectively, including accrued interest, of previously accrued acquisition purchase price in accordance with the asset purchase
agreements. There was no accrued purchase price remaining as of December 30, 2014 and $0.3 million of accrued purchase price
remaining as of December 31, 2013.
4. Investments Held to Maturity
During fiscal 2013, the Company purchased and sold seven zero-coupon discount notes that were classified as held-to-maturity.
The amortized cost of the investments sold was $97.9 million. The Company realized a loss on the sale of less than $0.1 million.
The Company sold the investments prior to maturity during fiscal 2013 as a result of higher than anticipated liquidity needs.
5. Fair Value Measurements
The Company’s $92.3 million and $18.1 million in cash equivalents at December 30, 2014 and December 31, 2013, respectively,
were carried at fair value in the Consolidated Balance Sheets based on quoted market prices for identical securities (Level 1 inputs).
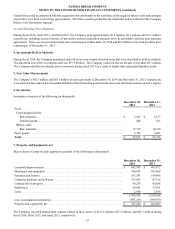
6. Inventories
Inventories consisted of the following (in thousands):
December 30,
2014
December 31,
2013
Food:
Fresh dough facilities:
Raw materials . . . . . . . . . . . . . . . . . . . . . . . . . . . . . . . . . . . . . . . . . . . . . . . . . . . . . . . . . . . $ 3,413 $ 3,377
Finished goods. . . . . . . . . . . . . . . . . . . . . . . . . . . . . . . . . . . . . . . . . . . . . . . . . . . . . . . . . . . 460 545
Bakery-cafes:
Raw materials . . . . . . . . . . . . . . . . . . . . . . . . . . . . . . . . . . . . . . . . . . . . . . . . . . . . . . . . . . . 15,152 14,329
Paper goods. . . . . . . . . . . . . . . . . . . . . . . . . . . . . . . . . . . . . . . . . . . . . . . . . . . . . . . . . . . . . . . . . 3,786 3,665
Total . . . . . . . . . . . . . . . . . . . . . . . . . . . . . . . . . . . . . . . . . . . . . . . . . . . . . . . . . . . . . . . . . . . . . . $ 22,811 $ 21,916
7. Property and Equipment, net
Major classes of property and equipment consisted of the following (in thousands):
December 30,
2014
December 31,
2013
Leasehold improvements . . . . . . . . . . . . . . . . . . . . . . . . . . . . . . . . . . . . . . . . . . . . . . . . . . . . . . $ 693,503 $ 607,472
Machinery and equipment . . . . . . . . . . . . . . . . . . . . . . . . . . . . . . . . . . . . . . . . . . . . . . . . . . . . . 340,854 305,060
Furniture and fixtures . . . . . . . . . . . . . . . . . . . . . . . . . . . . . . . . . . . . . . . . . . . . . . . . . . . . . . . . . 167,383 149,445
Computer hardware and software. . . . . . . . . . . . . . . . . . . . . . . . . . . . . . . . . . . . . . . . . . . . . . . . 137,663 87,316
Construction in progress. . . . . . . . . . . . . . . . . . . . . . . . . . . . . . . . . . . . . . . . . . . . . . . . . . . . . . . 99,255 80,108
Smallwares . . . . . . . . . . . . . . . . . . . . . . . . . . . . . . . . . . . . . . . . . . . . . . . . . . . . . . . . . . . . . . . . . 29,841 27,031
Land . . . . . . . . . . . . . . . . . . . . . . . . . . . . . . . . . . . . . . . . . . . . . . . . . . . . . . . . . . . . . . . . . . . . . . 2,060 2,856
1,470,559 1,259,288
Less: accumulated depreciation . . . . . . . . . . . . . . . . . . . . . . . . . . . . . . . . . . . . . . . . . . . . . . . . . (683,265)(589,879)
Property and equipment, net . . . . . . . . . . . . . . . . . . . . . . . . . . . . . . . . . . . . . . . . . . . . . . . . . . . . $ 787,294 $ 669,409
The Company recorded depreciation expense related to these assets of $115.4 million, $97.2 million, and $82.7 million during
fiscal 2014, fiscal 2013, and fiscal 2012, respectively.