Panera Bread 2014 Annual Report Download - page 34
Download and view the complete annual report
Please find page 34 of the 2014 Panera Bread annual report below. You can navigate through the pages in the report by either clicking on the pages listed below, or by using the keyword search tool below to find specific information within the annual report.-
 1
1 -
2
-
3
-
4
-
5
-
6
-
7
-
8
-
9
-
10
-
11
-
12
-
13
-
14
-
15
-
16
-
17
-
18
-
19
-
20
-
21
-
22
-
23
-
 24
24 -
 25
25 -
 26
26 -
 27
27 -
 28
28 -
 29
29 -
 30
30 -
 31
31 -
 32
32 -
 33
33 -
 34
34 -
 35
35 -
 36
36 -
 37
37 -
 38
38 -
 39
39 -
 40
40 -
 41
41 -
 42
42 -
 43
43 -
 44
44 -
45
-
46
-
47
-
48
-
49
-
50
-
51
-
52
-
53
-
54
-
55
-
56
-
57
-
58
-
59
-
60
-
61
-
62
-
63
-
64
-
65
-
66
-
67
-
68
-
69
-
70
-
71
-
72
-
73
-
74
-
75
-
76
-
77
-
78
-
79
-
80
-
81
-
82
-
83
-
84
-
85
-
86
-
87
-
88
 |
 |
22
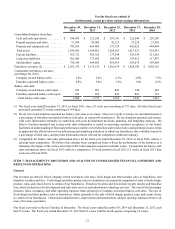
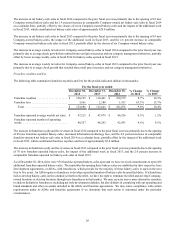
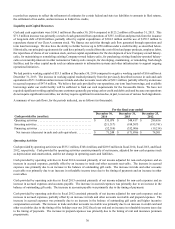
We include in this report information on Company-owned, franchise-operated, and system-wide comparable net bakery-cafe sales
percentages. Bakery-cafes in our comparable net bakery-cafe sales percentages include those bakery-cafes with an open date prior
to the first day of our prior fiscal year, which we refer to as our base store bakery-cafes. Company-owned comparable net bakery-
cafe sales percentages are based on net sales from Company-owned base store bakery-cafes. Franchise-operated comparable net
bakery-cafe sales percentages are based on net sales from franchise-operated base store bakery-cafes, as reported by franchisees.
System-wide comparable net bakery-cafe sales percentages are based on net sales at Company-owned and franchise-operated base
store bakery-cafes. Acquired Company-owned and franchise-operated bakery-cafes and other restaurant or bakery-cafe concepts
are included in our comparable net bakery-cafe sales percentages only if we or our franchisee previously held or acquired a
100 percent ownership interest prior to the first day of our prior fiscal year. Comparable net bakery-cafe sales exclude closed
locations.
We do not record franchise-operated net bakery-cafe sales as revenues. However, royalty revenues are calculated based on a
percentage of franchise-operated net bakery-cafe sales, as reported by franchisees. We use franchise-operated and system-wide
sales information internally in connection with store development decisions, planning, and budgeting analyses. We believe
franchise-operated and system-wide sales information is useful in assessing consumer acceptance of our brand, facilitates an
understanding of our financial performance and the overall direction and trends of sales and operating income, helps us appreciate
the effectiveness of our advertising and marketing initiatives, to which our franchisees also contribute based on a percentage of
their net sales, and provides information that is relevant for comparison within the industry.
We also include in this report information on Company-owned, franchise-operated, and system-wide average weekly net sales.
Average weekly net sales are calculated by dividing total net sales in the period by operating weeks in the period. Accordingly,
year-over-year results reflect sales for all locations, whereas comparable net bakery-cafe sales exclude closed locations and are
based on sales only from our base store bakery-cafes. New stores typically experience an opening “honeymoon” period during
which they generate higher average weekly net sales in the first 12 to 16 weeks after opening, after which customers “settle-in”
to normal usage patterns. On average, average weekly net sales during the “settle-in” period are 5 percent to 10 percent less than
during the “honeymoon” period. As a result, year-over-year results of average weekly net sales are generally lower than the results
in comparable net bakery-cafe sales. This results from the relationship of the number of bakery-cafes in the “honeymoon” period,
the number of bakery-cafes in the “settle-in” period, and the number of bakery-cafes in the comparable bakery-cafe base.
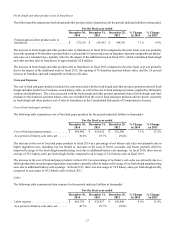
Executive Summary of Results
In fiscal 2014, we earned $6.64 per diluted share with the following performance on key metrics: system-wide comparable net
bakery-cafe sales growth of 1.1 percent on a calendar basis (growth of 1.4 percent for Company-owned bakery-cafes and growth
of 0.9 percent for franchise-operated bakery-cafes on a calendar basis); system-wide average weekly net sales increased 0.5 percent
to $47,655 ($48,114 for Company-owned bakery-cafes and $47,215 for franchise-operated bakery-cafes); 114 new bakery-cafes
opened system-wide (65 Company-owned bakery-cafes and 49 franchise-operated bakery-cafes); and 11 bakery-cafes closed
system-wide (seven Company-owned bakery-cafes and four franchise-operated bakery-cafes). Our fiscal 2014 earnings of $6.64
per diluted share included a favorable impact of $0.12 per diluted share from the repurchase in fiscal 2014 of 941,878 shares under
share repurchase authorizations, a benefit of $0.08 per diluted share from the favorable resolution of an insurance coverage matter
recorded in the fiscal quarter ended July 1, 2014, a favorable impact of $0.08 per diluted share for adjustments related to additional
federal tax credits and an increased deduction for domestic production activities recorded in the fiscal quarter ended September
30, 2014, and a goodwill impairment charge of $0.05 per diluted share recorded in the fiscal quarter ended December 30, 2014.
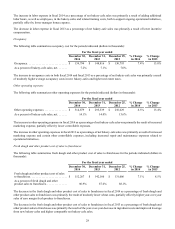
In the fiscal quarter ended December 30, 2014, we earned $1.82 per diluted share with the following performance on key metrics:
system-wide comparable net bakery-cafe sales growth of 3.0 percent on a calendar basis (growth of 3.3 percent for Company-
owned bakery-cafes and growth of 2.7 percent for franchise-operated bakery-cafes on a calendar basis); system-wide average
weekly net sales increased 2.3 percent to $49,458 ($50,002 for Company-owned bakery-cafes and $48,934 for franchise-operated
bakery-cafes); 40 new bakery-cafes opened system-wide (26 Company-owned bakery-cafes and 14 franchise-operated bakery-
cafes); and five bakery-cafes closed system-wide (four Company-owned bakery-cafes and one franchise-operated bakery-cafe).
Our fiscal quarter ended December 30, 2014 earnings of $1.82 per diluted share included the previously referenced goodwill
impairment charge of $0.05 per diluted share.
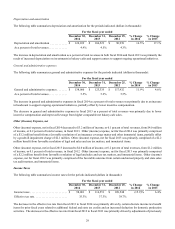
In fiscal 2013, we earned $6.81 per diluted share with the following performance on key metrics: system-wide comparable net
bakery-cafe sales growth of 2.3 percent (growth of 2.6 percent for Company-owned bakery-cafes and growth of 2.0 percent for
franchise-operated bakery-cafes), which reflects a comparative 53 week period in fiscal 2012; system-wide average weekly net
sales increased 1.6 percent to $47,403 ($47,741 for Company-owned bakery-cafes and $47,079 for franchise-operated bakery-
cafes); 133 new bakery-cafes opened system-wide (63 Company-owned bakery-cafes and 70 franchise-operated bakery-cafes);
and eight bakery-cafes closed system-wide (six Company-owned bakery-cafes and two franchise-operated bakery-cafes). Our
fiscal 2013 earnings of $6.81 per diluted share included a favorable impact of $0.14 per diluted share from the repurchase in fiscal
2013 of 1,992,250 shares under the share repurchase authorization approved by our Board of Directors in 2012, which we refer